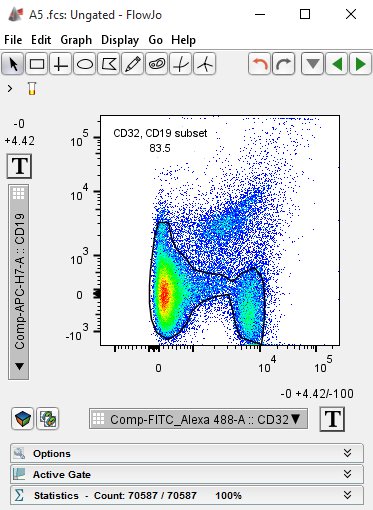
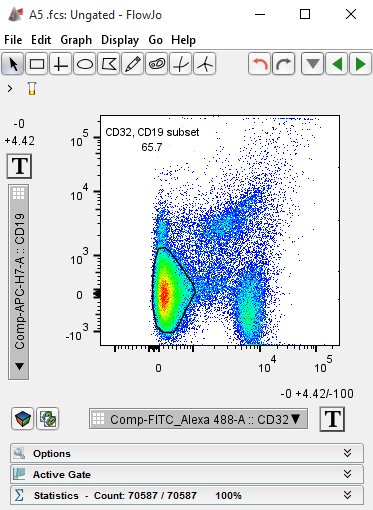
Click on the Auto gate tool button on a bivariate graph window to activate the auto gate feature. When moving the mouse over the graph, FlowJo will automatically find subpopulations to gate. These are shown on the graph window and change based upon equal probability distributions. This is the same algorithm used for identifying contour lines for contour plots. When the gate surrounds the population of interest, click once to create a gate (a polygon gate will be generated).
After creation, this gate is identical to any other polygon gate, it can be adjusted by hand, applied to additional samples, etc.
In the images below, the gate is shown shifting populations from a B Cell gate that includes unwanted events, to a tight gate on the B Cell population. The shift is in accordance with the probability densities that one would see if this were a contour plot, and illustrates the benefits of the contour plot in population identification.


See Also:
