See Also:
Spectral spreading affecting your data? FlowJo v10 has the cure. Curly quad gates are designed to account for the error introduced by intensely fluorescent data.
Why should we use curly quadrant gates?
The curly quadrant tool is a gating tool that creates a quadrant gate with curved arms. It is useful for data that exhibits spread due to photon counting error, which includes almost all fluorescent parameters.
Photo counting error is proportional to the square root of the intensity, so curly quads curve upward when one parameter is displayed on a log scale, and could be represented as a straight line with a slope of 1:2 when both parameters are displayed on a logarithmic scale. FlowJo still shows the quads as “curly” even on a log-log plot for stylistic reasons. Click here for a paper by Mario Roederer discussing the theory behind photon counting error and the 1:2 scale.
A curly quad is a non rectangular gate based on the error profiles of photomultiplier tubes (PMT). Each compensated fluorescence parameter in an FCS file has a bivariate detection limit represented by the formula p2=a*p1^0.5 +b, where p1 and p2 are the two parameters in the plot, and a is a parameter modeling curliness from secondary PMT noise, and b models background fluorescence.
Selecting curly quadrants
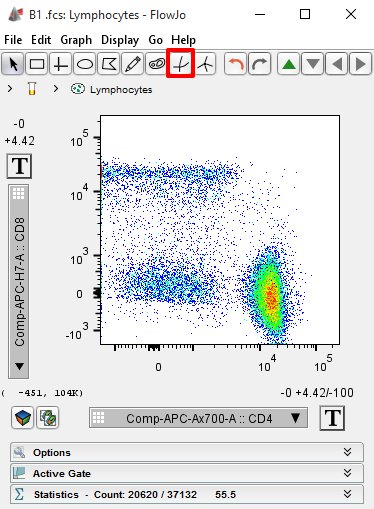
Curly quadrants can be selected from the gating tool bar at the top of the graph window as shown in the figure below. To use the Curly Quad gating tool both parameters must be fluorescent.

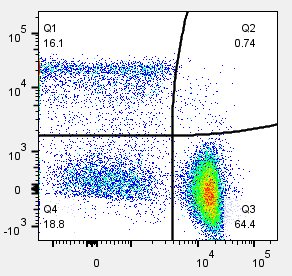
Once you select the Curly Quad icon a set of curled quads will appear on your Graph Window. As you move the mouse around the screen the shape of the quadrants will change to match the intensity. The lines below and to the left of the intersection point will always be straight so that the user may indicate where the upper limits of background fluorescence are, which makes this an effective tool to use with FMO controls. Flowjo will then curve the quads based on the intensity of the axes beyond the intersection point. Once created the gates can be modified by clicking on the intersection point and dragging it. An example of an applied curly quad is shown below using data that demonstrates the effect of spreading due to photon counting error dramatically.

When you create a curly quad gate the quadrant name and the frequencies of events within each quadrant will be displayed by default. Either piece of information can be disabled using the preferences. Curly quads can be applied to a group of samples, added to a table in the table editor, or displayed in the layout editor just like traditional quads.

Statistics can also be applied to any or all the curly quadrant populations. For example, you may be interested in the median fluorescence intensity of CD8 expression in quadrant #1. Simply select the quadrant population you are interested in and then click the statistics band. Select the statistic you want (e.g. Median) and the parameter (e.g. CD8). The statistic will then be added to the workspace, indented beneath the selected quadrant (see below).


