A tethered gate derives its position from a statistical operation.
In FlowJo a range gate in a histogram can be dynamically positioned by a function of the data itself.
The tether gate feature makes it possible to set a gate dependent on a statistic and have that gate adjust from sample to sample when applied to the group.
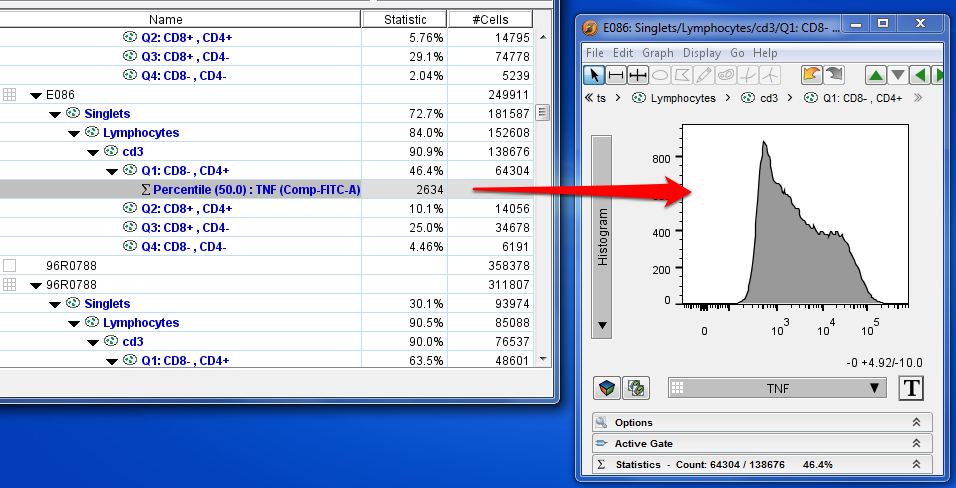
To create a tethered gate, such as a gate including the fiftieth percentile of cells, we need two things, a graph window showing a histogram of the parameter we are gating, and a statistics node in the workspace that describes the property we want to use as gating criteria, in this case, a fiftieth percentile stat of our parameter:

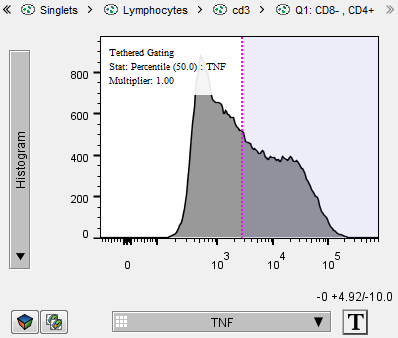
When you drag the statistic node on top of the open graph window, the interface changes to indicate you’re making a tethered gate. Before you let go of your left mouse button, you may drag sideways to adjust the multiplier. Below, I placed the gate at 1.0x multiplier value.

Specifically what it happening is that the lower bound of the gate is being placed at the value of the dragged statistic multiplied by whatever multiplier you choose, and the upper bound is set to be the maximum value. So any statistic can be dragged in and used as the value for the lower bound, but none will make as much sense to use as the percentile, or perhaps some measure of central tendency.
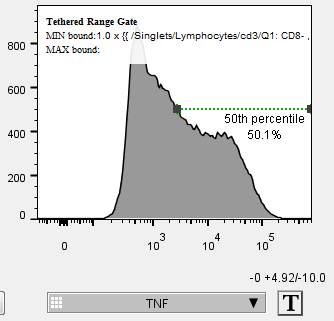
After the multiplier has been selected the gate will become a green-dotted line “tethered” to the fiftieth percentile of the TNF distribution.

The top of the plot shows the definition of the current gate, including the multiplier. Once created, this gate is no longer move-able sideways, only up-and-down. There is currently no way to edit the definition of an existing tethered gate without deleting and recreating it.
The most common use case for a gate tethered in this manner is any kind of structured study or gating regime that defines the population of interest based on strict statistics, such as the upper 10th percentile, or events greater than the mode.
See Also:

