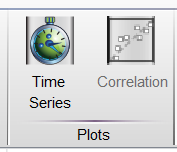
The Plots Band allows the user to view different visual representations of comparisons between columns in the Table Editor. In addition to viewing a Time Series graph for any column in the table, the user can view a correlation graph or line plot by selecting two statistic columns at the same time, or a three-dimensional plot by selecting three statistic columns at once.

Time Series
Construct a time series plot of any number of table columns against the collection time of the sample.
Correlation
Construct a correlation plot including linear regression of two selected table columns. Computes slope, intercept, and Pearson’s Coefficient for the line fitting the data.
Learn More:
Plots in the Table Editor
For more information about the Table Editor, please see:
Tabular Reports in the Table Editor
Heat Maps & Conditional Formatting
Statistics in the Table Editor
Time Series Plots in the Table Editor
