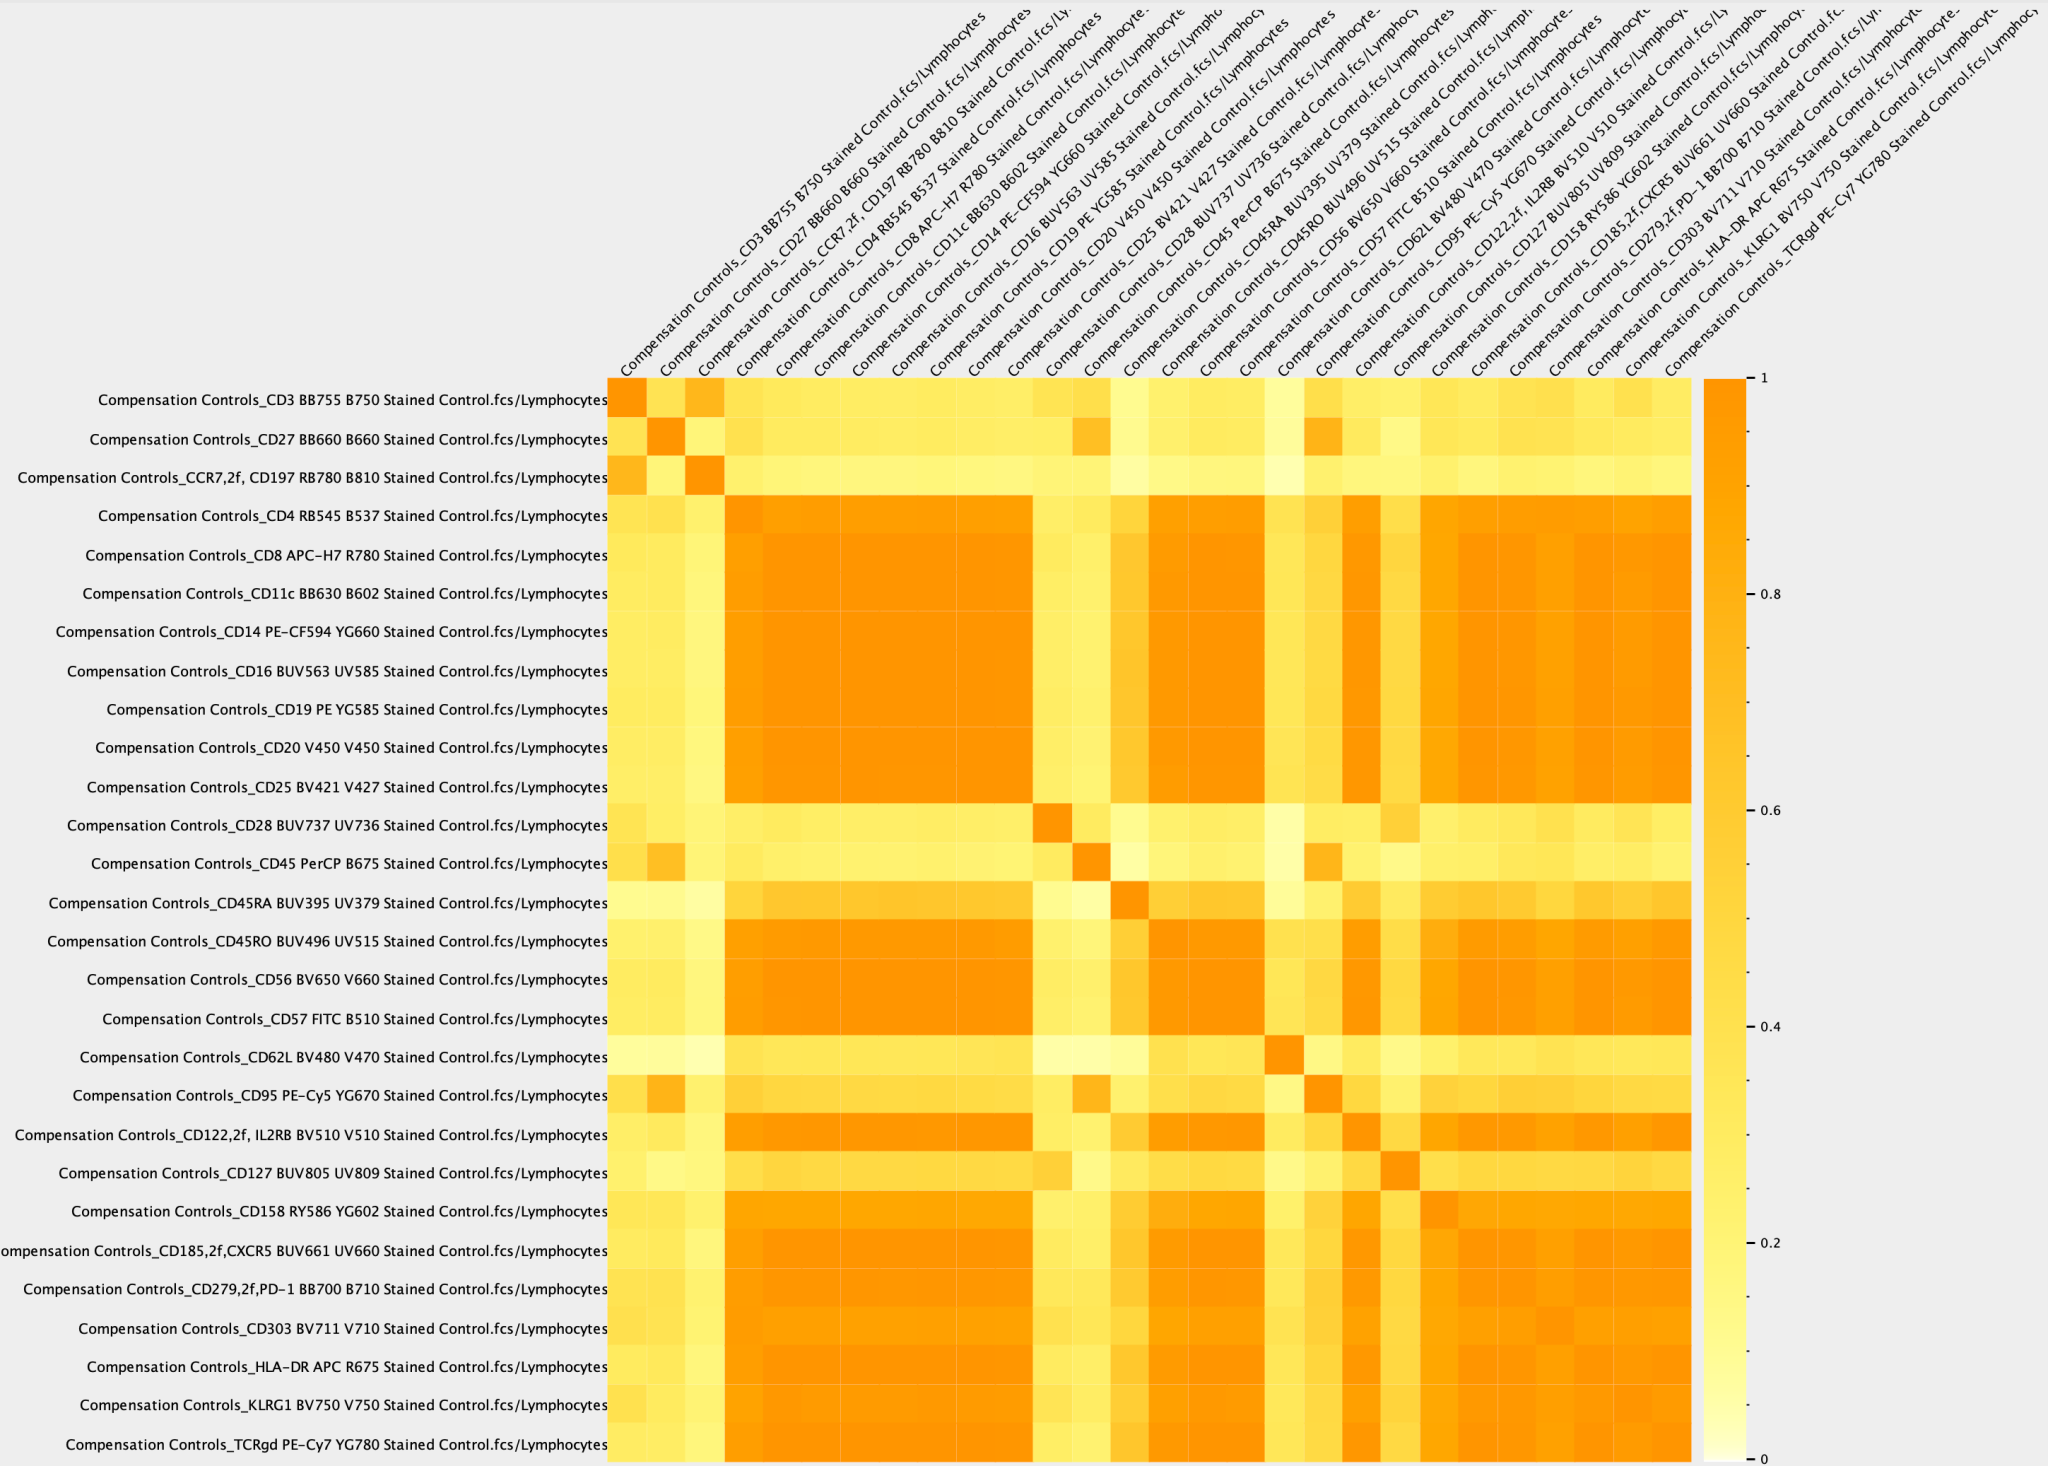
Cosine similarity is a measure of similarity between two vectors. In cytometry we use if for measuring similarity of the signal produced by two fluorochromes across all detectors.
Cosine similarity is based on the cosine of the angle between two vectors in n-dimensional space. Imagine a two-dimensional example, in which the x and y coordinate are the signal from two detectors. If two fluorochromes produce the same relative expression pattern, the angle will be the same. It follows that the cosine similarity does not depend on the magnitudes of the vectors, but only on their angle. It is calculated by taking the dot product of the vectors divided by the product of their lengths.
In cytometry, CSM values will vary from 0 to 1 with 1 indicating identical intensities across all detectors. For the purposes of designing a panel, lower is better and the threshold for ‘usable’ is in the vicinity of 0.9 depending greatly on many experimental design considerations. The CSM is usually visualized in a table with each fluorochrome listed on both axes, and the diagonal representing a fluorochrome compared to itself.

In FlowJo 10.9.0 and later, a cosine similarity matrix is created when a compensation matrix is calculated in the compensation wizard. From the Compensation Wizard, the CSM can be visualized and/or exported from the CSM button as shown below.

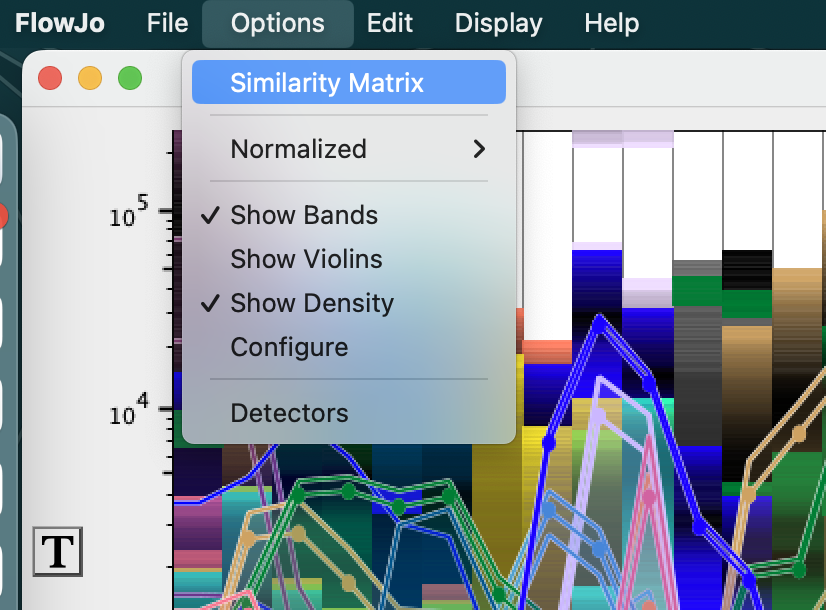
As of FlowJo 10.10 it is also available through the spectral plots tool, available from the Options dropdown as shown below:

In the context of flow cytometry, a CSM can be calculated from single color compensation controls, providing a pairwise comparison of the similarity between emission spectra of all fluorochromes employed in a staining panel. This information can be used in the panel design process to inform on the degree of similarity between fluorochromes. High cosine similarity scores (closer to 1) between fluorochrome pairs generally indicate higher compensation values and increased spillover spreading will occur between those two fluorochromes if used in the same staining panel, and these combinations may want to be avoided. Employing fluorochrome combinations that have low cosine similarity scores (closer to 0) will generally produce better results with lower compensation values and lower spillover spreading, yielding increased sensitivity to detect low expressing antigens within populations that co-express that pair of fluorochromes.
