Plugins add a wealth of features to FlowJo adding on to its analysis base.
These plugins can be downloaded from the FlowJo Exchange on our website. The FlowJo plugins are constantly being updated with new tools designed by the research community, allowing users to stay on the cutting edge of analysis. Each plugin has a unique set of functions that it adds to FlowJo. They also each have different steps for installation. The following videos explain those new features and lead users through the basic steps necessary to use plugins.
Installing Plugins
An Overview of Plugins
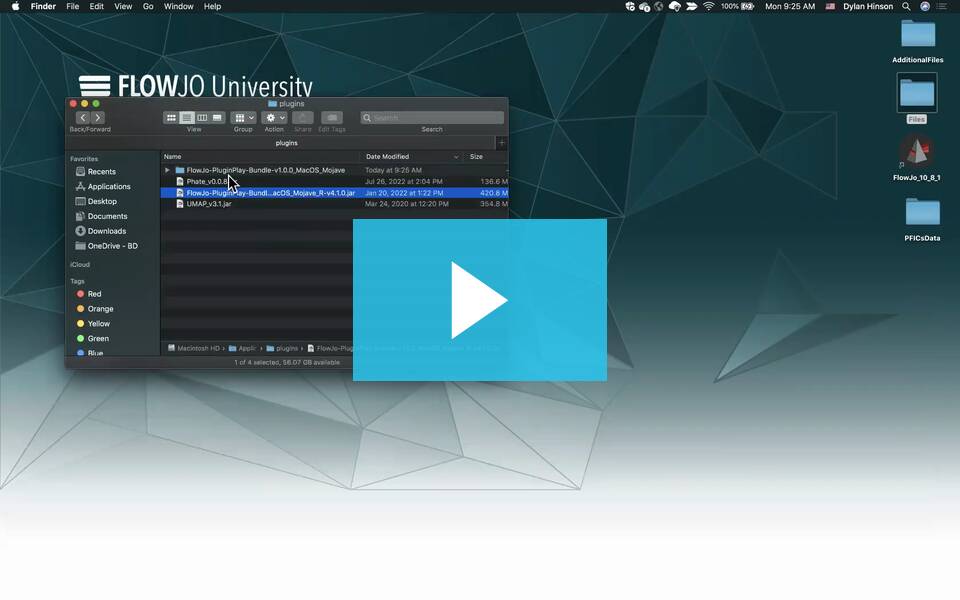
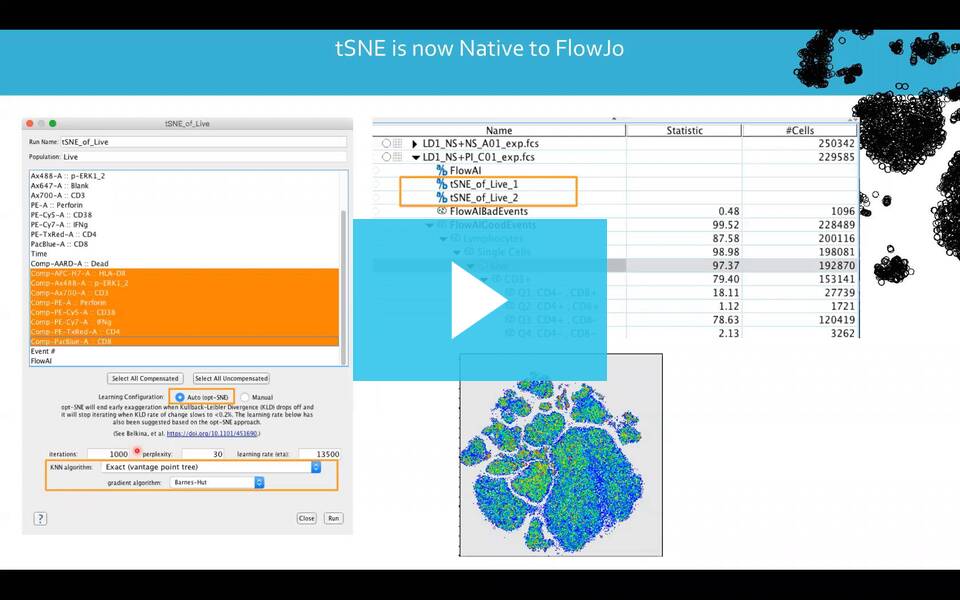
The following video demonstrates how to install plugins and provides an overview of how to use some of the most popular Plugins available in FlowJo. Flow scientist Luthy describes the various functions of plugins and compares some of the pros and cons of the analysis these plugins offer. The scientist then shows how to use several plugins together to generate a robust flow analysis.
FlowSOM
FlowSOM is a state of the art (see review: https://www.ncbi.nlm.nih.gov/pubmed/27992111) clustering and visualization technique, which analyzes flow or mass cytometry data using self-organizing maps. With two-level clustering and star charts, the algorithm helps to obtain a clear overview of how all markers are behaving on all cells, and to detect subsets that might be missed otherwise. The method has been implemented as a R/BioConductor library and published in Van Gassen et al., Cytometry A, 2015: https://www.ncbi.nlm.nih.gov/pubmed/25573116.
Phenograph
Phenograph is a clustering method designed for high-dimensional single cell data. It works by creating a graph (“network”) representing phenotypic similarities between cells and then identifying communities in this graph.
The algorithm was originally described in Levine et al. Data-Driven Phenotypic Dissection of AML Reveals Progenitor-like Cells that Correlate with Prognosis. Cell 162, 184–197, July 2, 2015, Elsevier Inc. http://dx.doi.org/10.1016/j.cell.2015.05.047
UMAP
Uniform Manifold Approximation and Projection (UMAP) is a machine learning algorithm used for dimensionality reduction to visualize high parameter datasets in a two-dimensional space, an alternative to the very popular and widely used tSNE algorithm. The bioinformatics tool was developed by McInnes and Healy.
Read more: McInnes, Healy,. UMAP: Uniform Manifold Approximation and Projection for Dimension Reduction. Feb, 2018. arXiv:1802.03426
TriMap
TriMap performs dimensionality reduction utilizing relationships in high parameter space to construct an “embedded” space approximating the data structure from higher dimensionality similar to tSNE and UMAP. This algorithm attempts to preserve the global structure of a dataset. The advantage of TriMap over other dimensionality reduction algorithms such as tSNE or LargeVis is that it is capable of more robustly maintaining global relationships between populations within a data matrix.
The TriMap algorithm has been developed and implemented as a Python package by Ehsan Amid and Manfred K. Warmuth, from the Department of Computer Science out of the University of California, Santa Cruz as described in Amid, Ehsan, and Manfred K. Warmuth. “TriMap: Large-scale Dimensionality Reduction Using Triplets.” arXiv preprint arXiv:1910.00204 (2019)
iCellR
The iCellR plugin is built on the R package ‘iCellR’ by Alireza “Reza” Khodadadi-Jamayran, a Senior Bioinformatics Software Engineer at NYU. The iCellR tool is designed to analyze high parameter single-cell data in R. The iCellR plugin by BD Life Science – Informatics extends this functionality to users who work with data from scRNA-seq data in SeqGeq, or even flow cytometry data in FlowJo. Users can perform: clustering (from the nbClust R package), tSNE, UMAP, and PCA analyses – simultaneously – and view the results in an interactive 3D plot using GoogleChrome. In SeqGeq, there is additional functionality to perform Differential Expression Analysis on a categorical clustering parameter based on an unsupervised clustering algorithm, or SampleID, at the click of a button. Available for both FlowJo and SeqGeq, with some dependencies in R.
Read more in: iCellR: Combined Coverage Correction and Principal Component Alignment for Batch Alignment in Single-Cell Sequencing Analysis, Alireza Khodadadi-Jamayran, Joseph Pucella, Hua Zhou, Nicole Doudican, John Carucci, Adriana Heguy, Boris Reizis, Aristotelis Tsirigos, bioRxiv 2020.03.31.019109; doi: https://doi.org/10.1101/2020.03.31.019109
Violin-Box Plots
Violin and box plots are popular ways of illustrating expression patterns between genes or proteins of interest and across different populations or samples. This updated version of ViolinBoxPlots now includes Raincloud Plots, an updated take on ViolinBoxPlots. These plots include a ‘split-half violin’, jittered data points, and a standard visualization of central tendency and error via the boxplot. In FlowJo and SeqGeq these features have been implemented as a plugin with some dependencies in R.
The plugin was based off the R library developed by Allen M, Poggiali D, Whitaker K, Marshall TR, Kievit R. 2018. Raincloud plots: a multi-platform tool for robust data visualization. PeerJ Preprints 6:e27137v1 https://doi.org/10.7287/peerj.preprints.27137v1
CytoNorm
The CytoNorm algorithm has been developed and implemented as an R package by Sofie Van Gassen PhD, from the Saeys Lab out of the University of Belgium, in Ghent. The purpose of the tool is to normalize batch effects in flow cytometric datasets collected in different batches, based on a similar set of controls run with each batch. CytoNorm works best if a control sample is provided for each batch. These control samples are used to normalize each batch to a common FlowSOM ‘spline’. (1) The CytoNorm plugin requires that each sample – both controls and different batches – contain a common parameter set named exactly the same for each FCS file.
Also see “CytoNorm: A Normalization Algorithm for Cytometry Data” Van Gassen S, Gaudilliere B, Angst MS, Saeys Y, Aghaeepour N Cytometry A. 2019
A longer tutorial on using CytoNorm:
FlowAI
The FlowAI tool allows users to clean their data using a new algorithm developed by Gianni Monaco et al. at the SIgN (A*STAR). FlowAI works by checking parameters over time and looking for deviations outside the statistical norm. FlowAI provides similar outputs as the FlowClean tool, but with more sensitivity.
After starting the plugin, flowAI will evaluate three different properties: flow rate, signal acquisition, and dynamic range. The quality control performed by the flowAI plugin enables the detection and removal of anomalies. This plugin will produce two new populations named, BadEvents and GoodEvents, further gating should be continued from the GoodEvents population. After the plugin has completed, drag the flowAI node into a new Layout in the Layout Editor to view the .png image of the report generated from flowAI.
The algorithm is described in Gianni Monaco et al. flowAI: automatic and interactive anomaly discerning tools for flow cytometry data. Bioinformatics 2016, 1-8 https://doi.org/10.1093/bioinformatics/btw191
FlowClean
Modern flow cytometers allow hundreds of samples to be analyzed in a single day. Data quality control remains challenging and it is further complicated when large number of parameters are measured. In particular, fluorescence measurements for a sample over the collection time may not remain stable due to fluctuations in fluid dynamics. In order to address this issue, FlowClean was developed, an algorithm that automatically identifies and flags fluorescence anomalies in flow cytometry data so that these can be easily removed.
Learn more using the FlowClean plugin in this blog post.
Also read the original manuscript in Fletez-Brant K, Spidlen J, Brinkman R, Roederer M and Chattopadhyay P. FlowClean: Automated Identication and Removal of Fluorescence Anomalies in Flow Cytometry Data. Cytometry A (PMID: 26990501)
Stain Index
The Stain Index plugin is a tool that allows researchers to quickly preform the Stain Index calculation on their data in FlowJo. The Stain Index calculation is a metric that quantifies the relative brightness of the stains used in a panel. The Stain Index value can be useful when designing panels and when analyzing titration assays.
MiST
MiST, which stands for Minimum Spanning Tree – allows researchers to visualize any population hierarchy from their workspace within an interactive shiny app, hosted from R. These hierarchies are shown as a visual network where individual populations become “nodes”, and their relationships between other populations are “edges” illustrated as connecting lines. Within that tool researchers can customize their minimum spanning tree diagrams by: sizing their nodes relative to population counts, coloring by a single parameter, or create a radar plot per population of a multitude of parameters. Available for both SeqGeq and FlowJo.
Sunburst
Sunburst plots are a graph type used for visualizing population hierarchies in a radial design around a central hub (“root population”). The graphic has been implemented as a plugin for FlowJo and SeqGeq. It opens in a browser using a Shiny App architecture, allowing for interactive options in order to change color palettes and formatting options. The mouse over annotation displays information about the population counts. Clicking on a population focuses in on that population and its children. This powerful graphic offers another great way for researchers to represent their data.
If you have any questions about plugins reach out: flowjo@bd.com
Tags: FlowJo

