Introduction
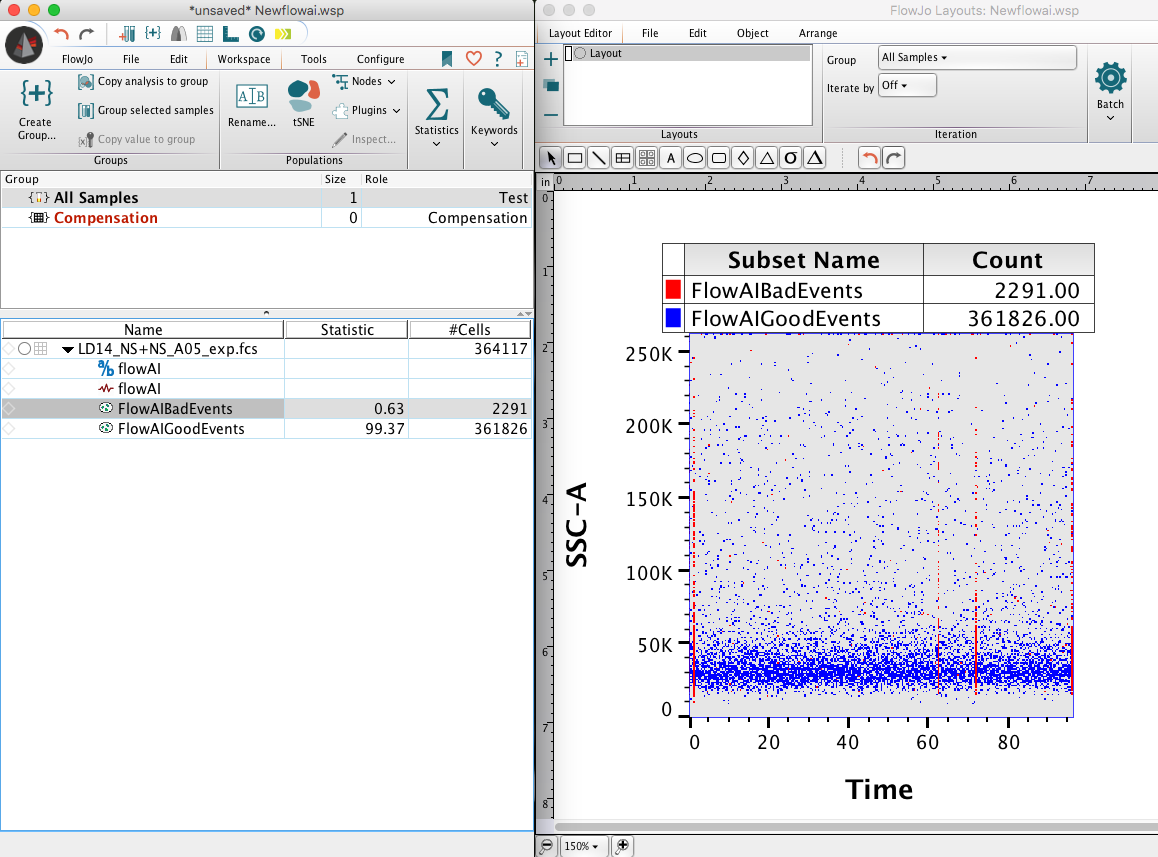
The flowAI plugin is able to perform an automatic quality control on your FCS data. After starting the plugin, flowAI will evaluate three different properties: flow rate, signal acquisition, and dynamic range. The quality control performed by the flowAI plugin enables the detection and removal of anomalies. This plugin will produce two new populations named, BadEvents and GoodEvents, further gating should be continued from the GoodEvents population.
After the plugin has completed, drag the flowAI node into a new Layout in the Layout Editor to view the .png image of the report generated from flowAI.
Please review FlowJo documentation for installing plugins
Compensation and Quality Check Using Plugins 5/7/20 (Christopher)
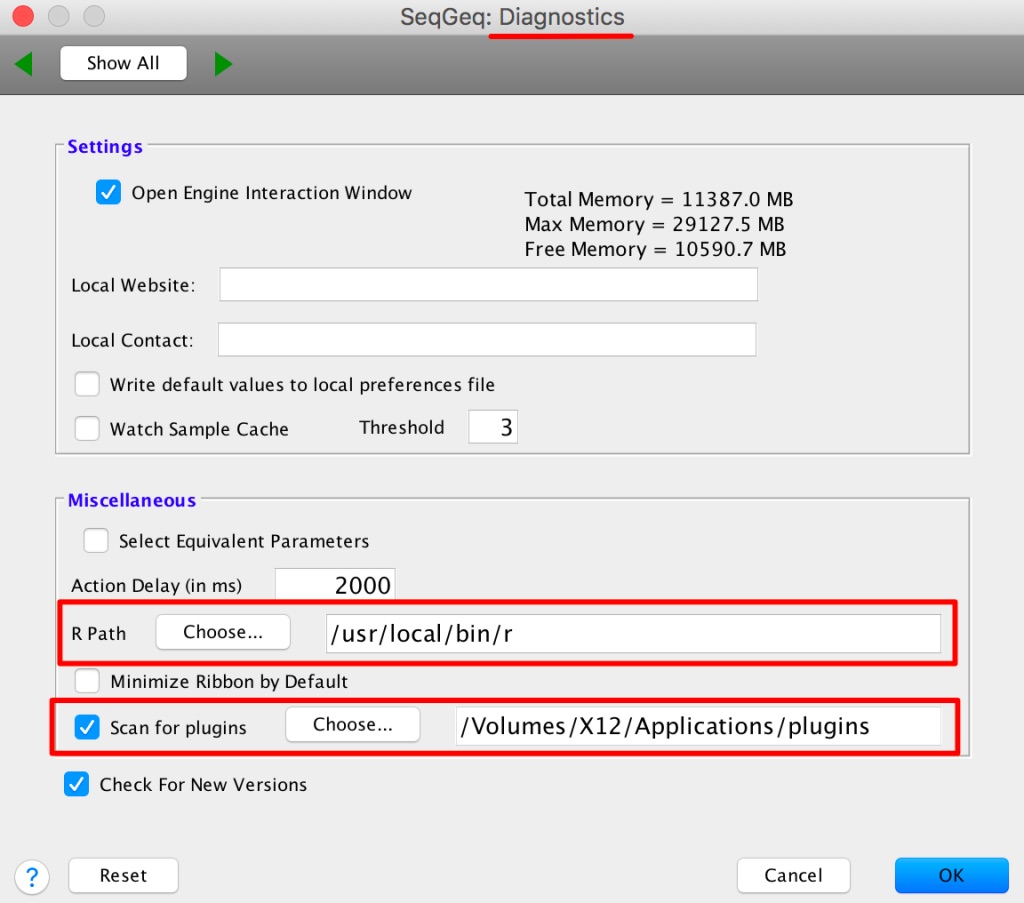
1. Place the plugin .jar file in your Plugins folder, and direct FlowJo to that folder using the Diagnostics section of the Preferences.
2. Make sure you have R installed and the R path is specified in the R Path field of the Diagnostics section of the Preferences.

3. Install the flowAI R library in your R, the flowAI plugin was tested with flowAI version 1.14.0. The flowAI R library can be installed by typing (or copy/pasting) the following in your R console:
if (!requireNamespace("BiocManager", quietly = TRUE))

install.packages("BiocManager")

BiocManager::install()

BiocManager::install("flowAI")

install.packages("png")
Note: For older versions of R, please refer to the appropriate Bioconductor release: https://bioconductor.org/about/release-announcements/
4. Restart the FlowJo application to pick up the new plugin.
Usage
To run the flowAI plugin on your FCS file,
1. Select the sample of interest within the workspace.
2. Go to the Workspace tab and select the flowAI option from within the Plugins dropdown there. Note that plugins will be unavailable (greyed out) if no population is selected.

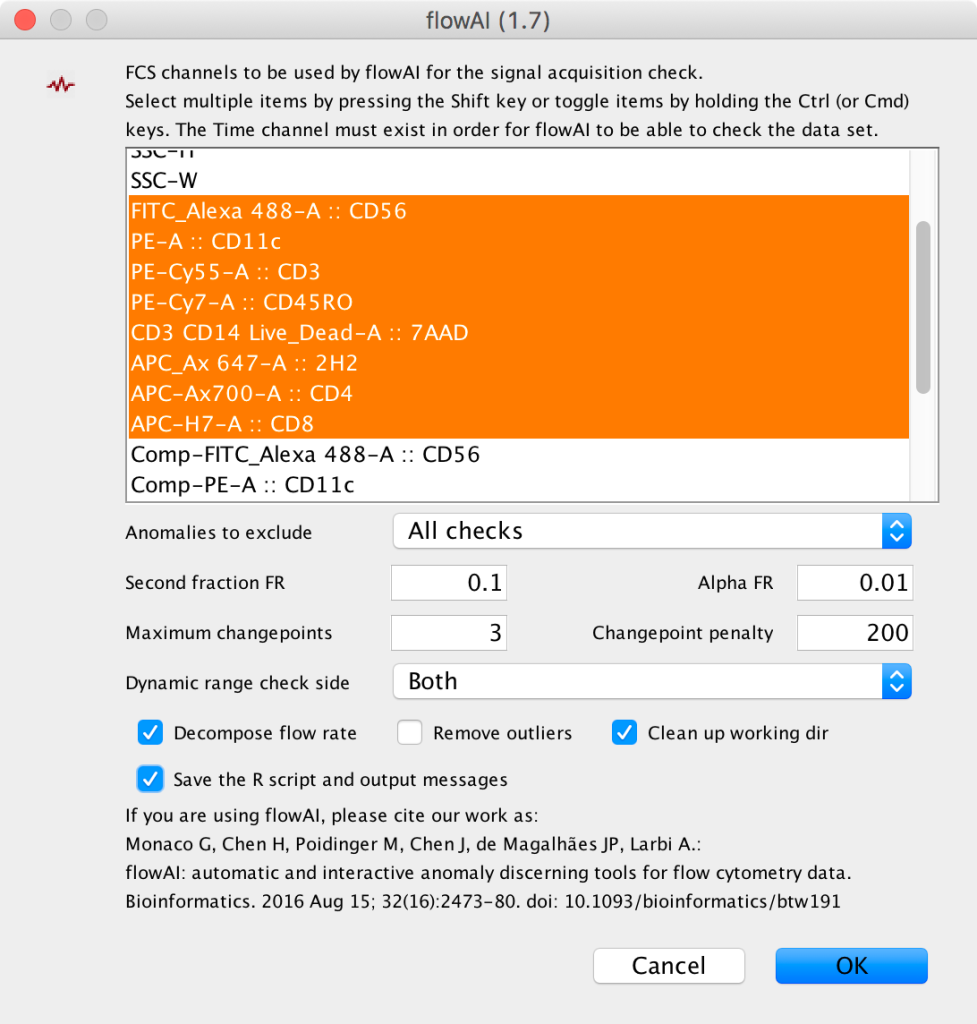
3. This will bring up a dialog where researchers can choose which parameters to use for signal acquisition checking across the Time (or Event#) parameter. There are a variety of other options available to customize this checking there. Mousing over the fields will bring up a tool tip which describes the field’s function:

4. After running the plugin on your data, a new derived parameter and a set of GoodEvents/BadEvents populations will be created. The flowAI population can be compared with the raw population’s Time parameter in order to view the clean-up performed:

The flowAI node associated with a population can also be dragged into a layout for more feedback on the results:

Leave us your feedback
Please write to flowjo@bd.com with any questions or concerns.
References
1. Gianni Monaco et al. flowAI: automatic and interactive anomaly discerning tools for flow cytometry data. Bioinformatics 2016, 1-8 https://doi.org/10.1093/bioinformatics/btw191

