Installing FlowSOM
1. In order to use the FlowSOM plugin, you will need FlowJo 10.4.1 or later, R 4.1 or later and FlowSOM 2.0.0 or later. With older versions of FlowJo, FlowSOM may still appear to work, but the results when running on subpopulations will be wrong!
2. Place the plugin .jar file in your Plugins folder.
a) If you don’t have a Plugins folder, use your operating system to create one.
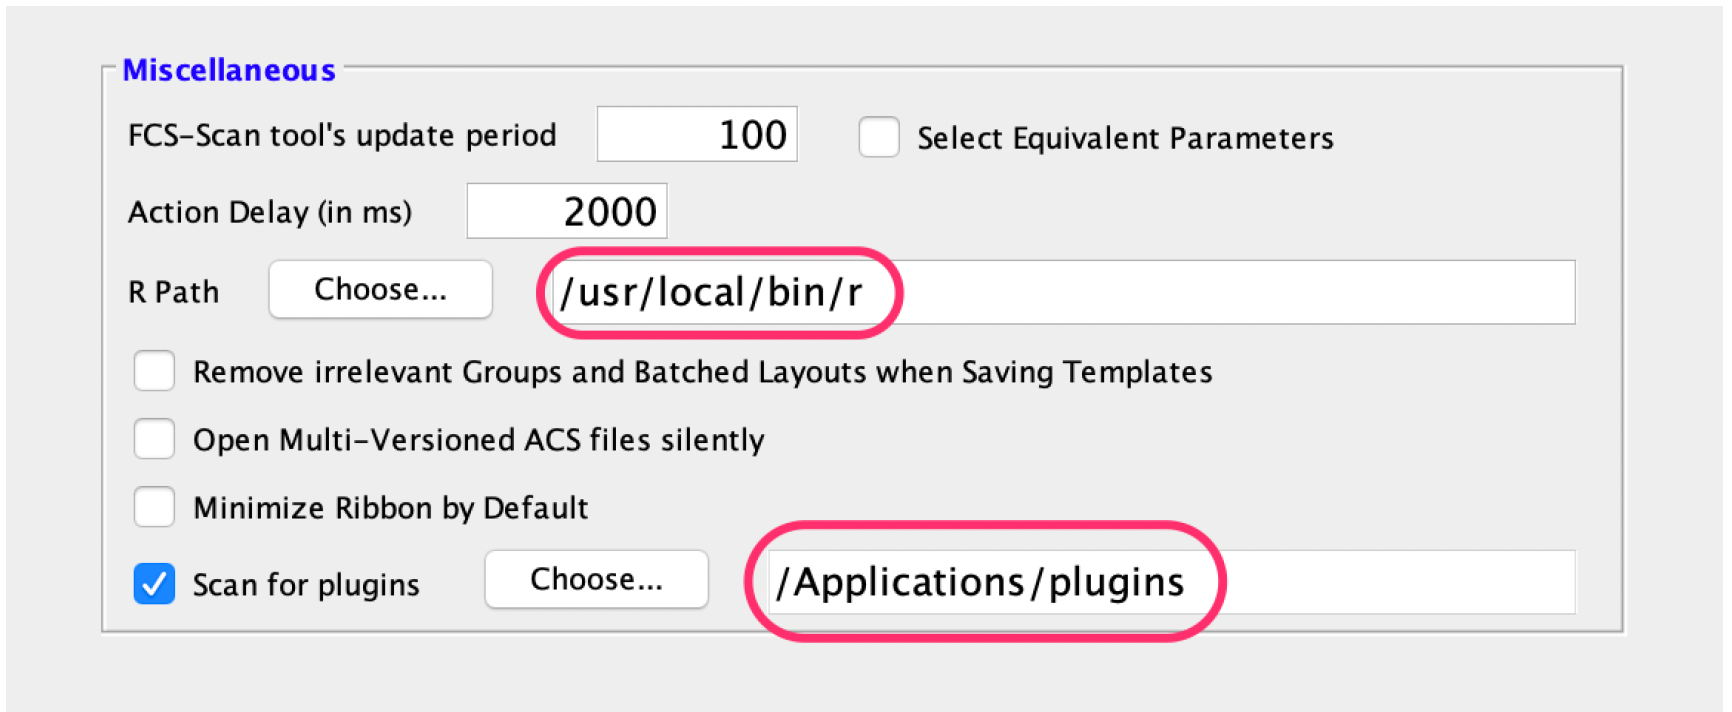
3. Direct FlowJo to that folder using the Diagnostics section of the Preferences.
4. Make sure you have the application R installed and the R path is specified in the R Path field of the
Diagnostics section of the Preferences.
5. The first time you run FlowSOM, it will download and install the dependencies it requires in R.
a) These can be also be manually installed in your R by typing the following in your R console:
if (!requireNamespace("BiocManager", quietly = TRUE))
install.packages("BiocManager")

BiocManager::install()
BiocManager::install(c("flowCore", "FlowSOM"))

install.packages("pheatmap")
Note: For older versions of R, please refer to the appropriate Bioconductor release: (https://bioconductor.org/about/release-announcements/)
Self-Organizing Map (SOM)
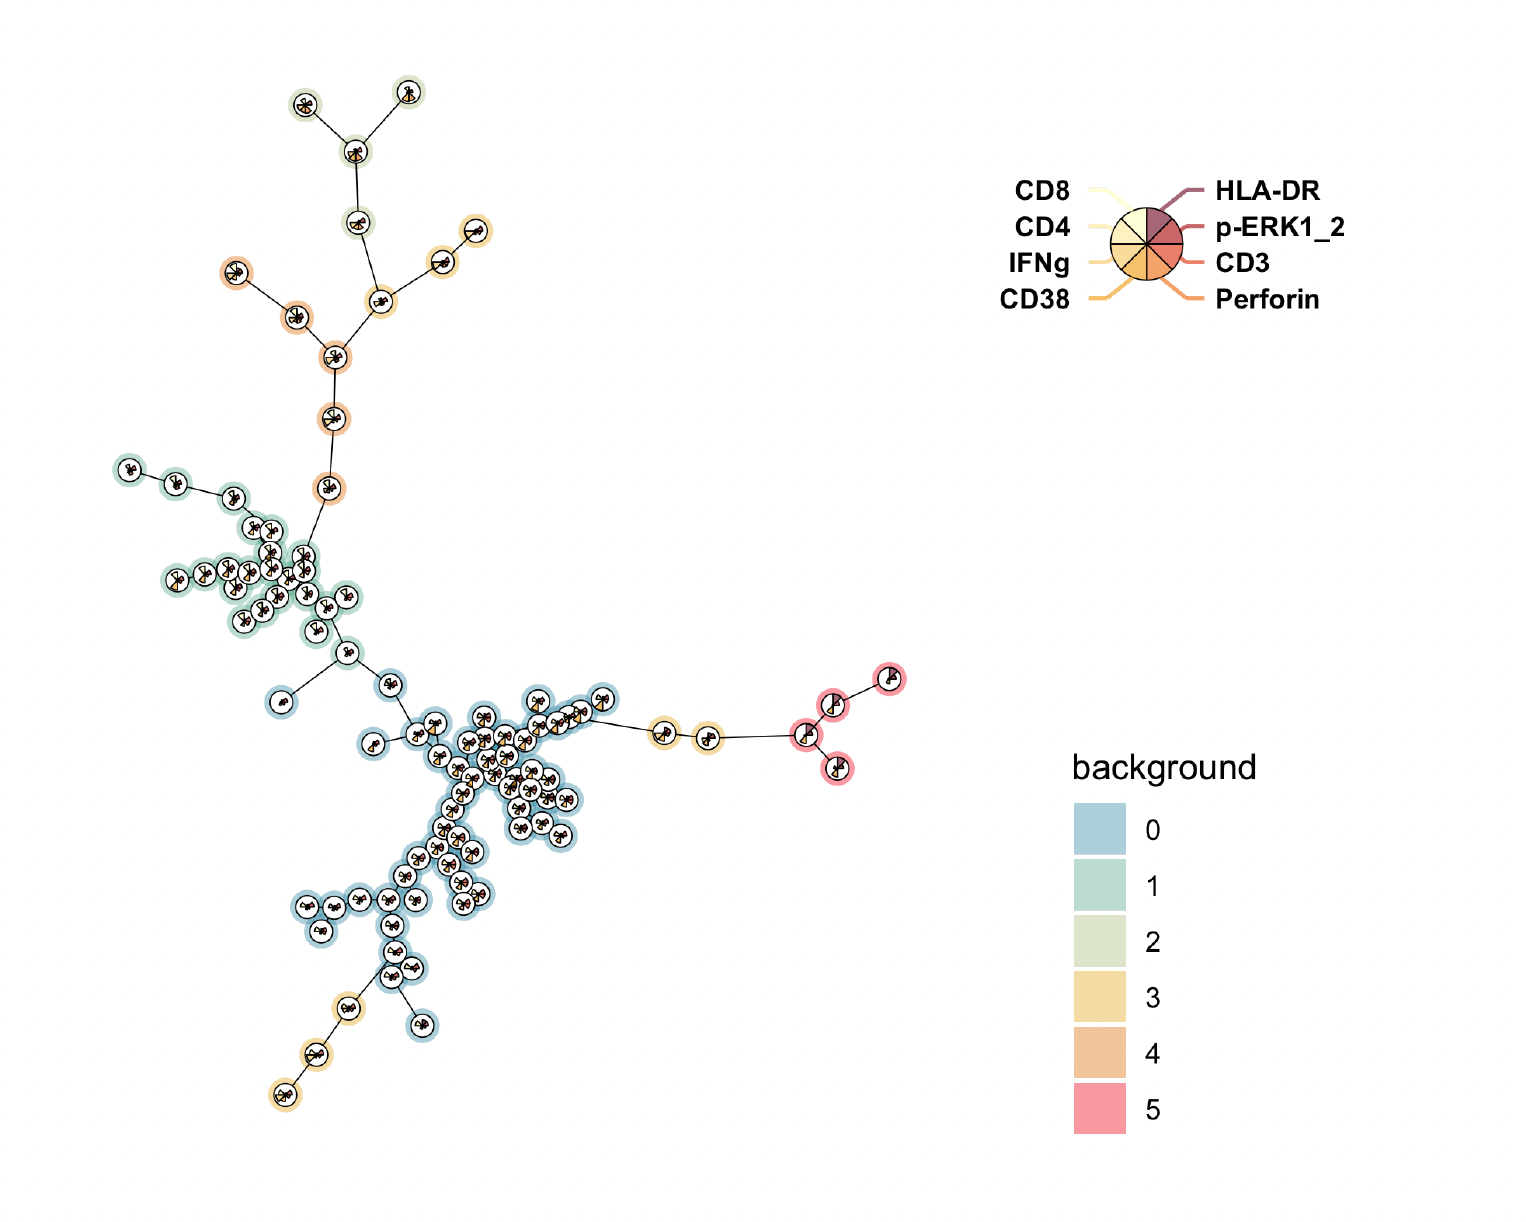
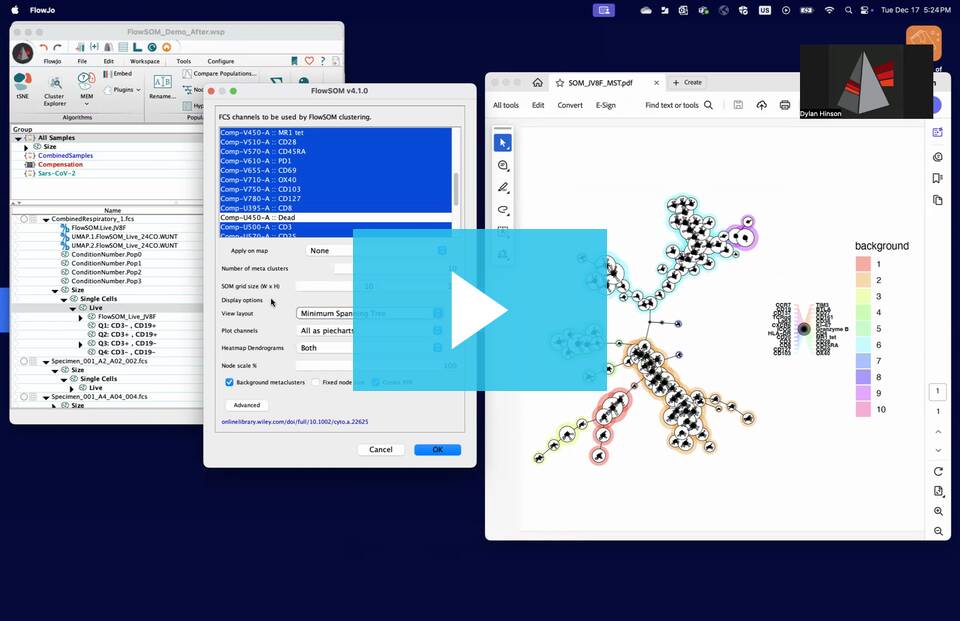
After running FlowSOM, drag the FlowSOM node from the workspace to an open Layout in the Layout Editor to view the output, for example:

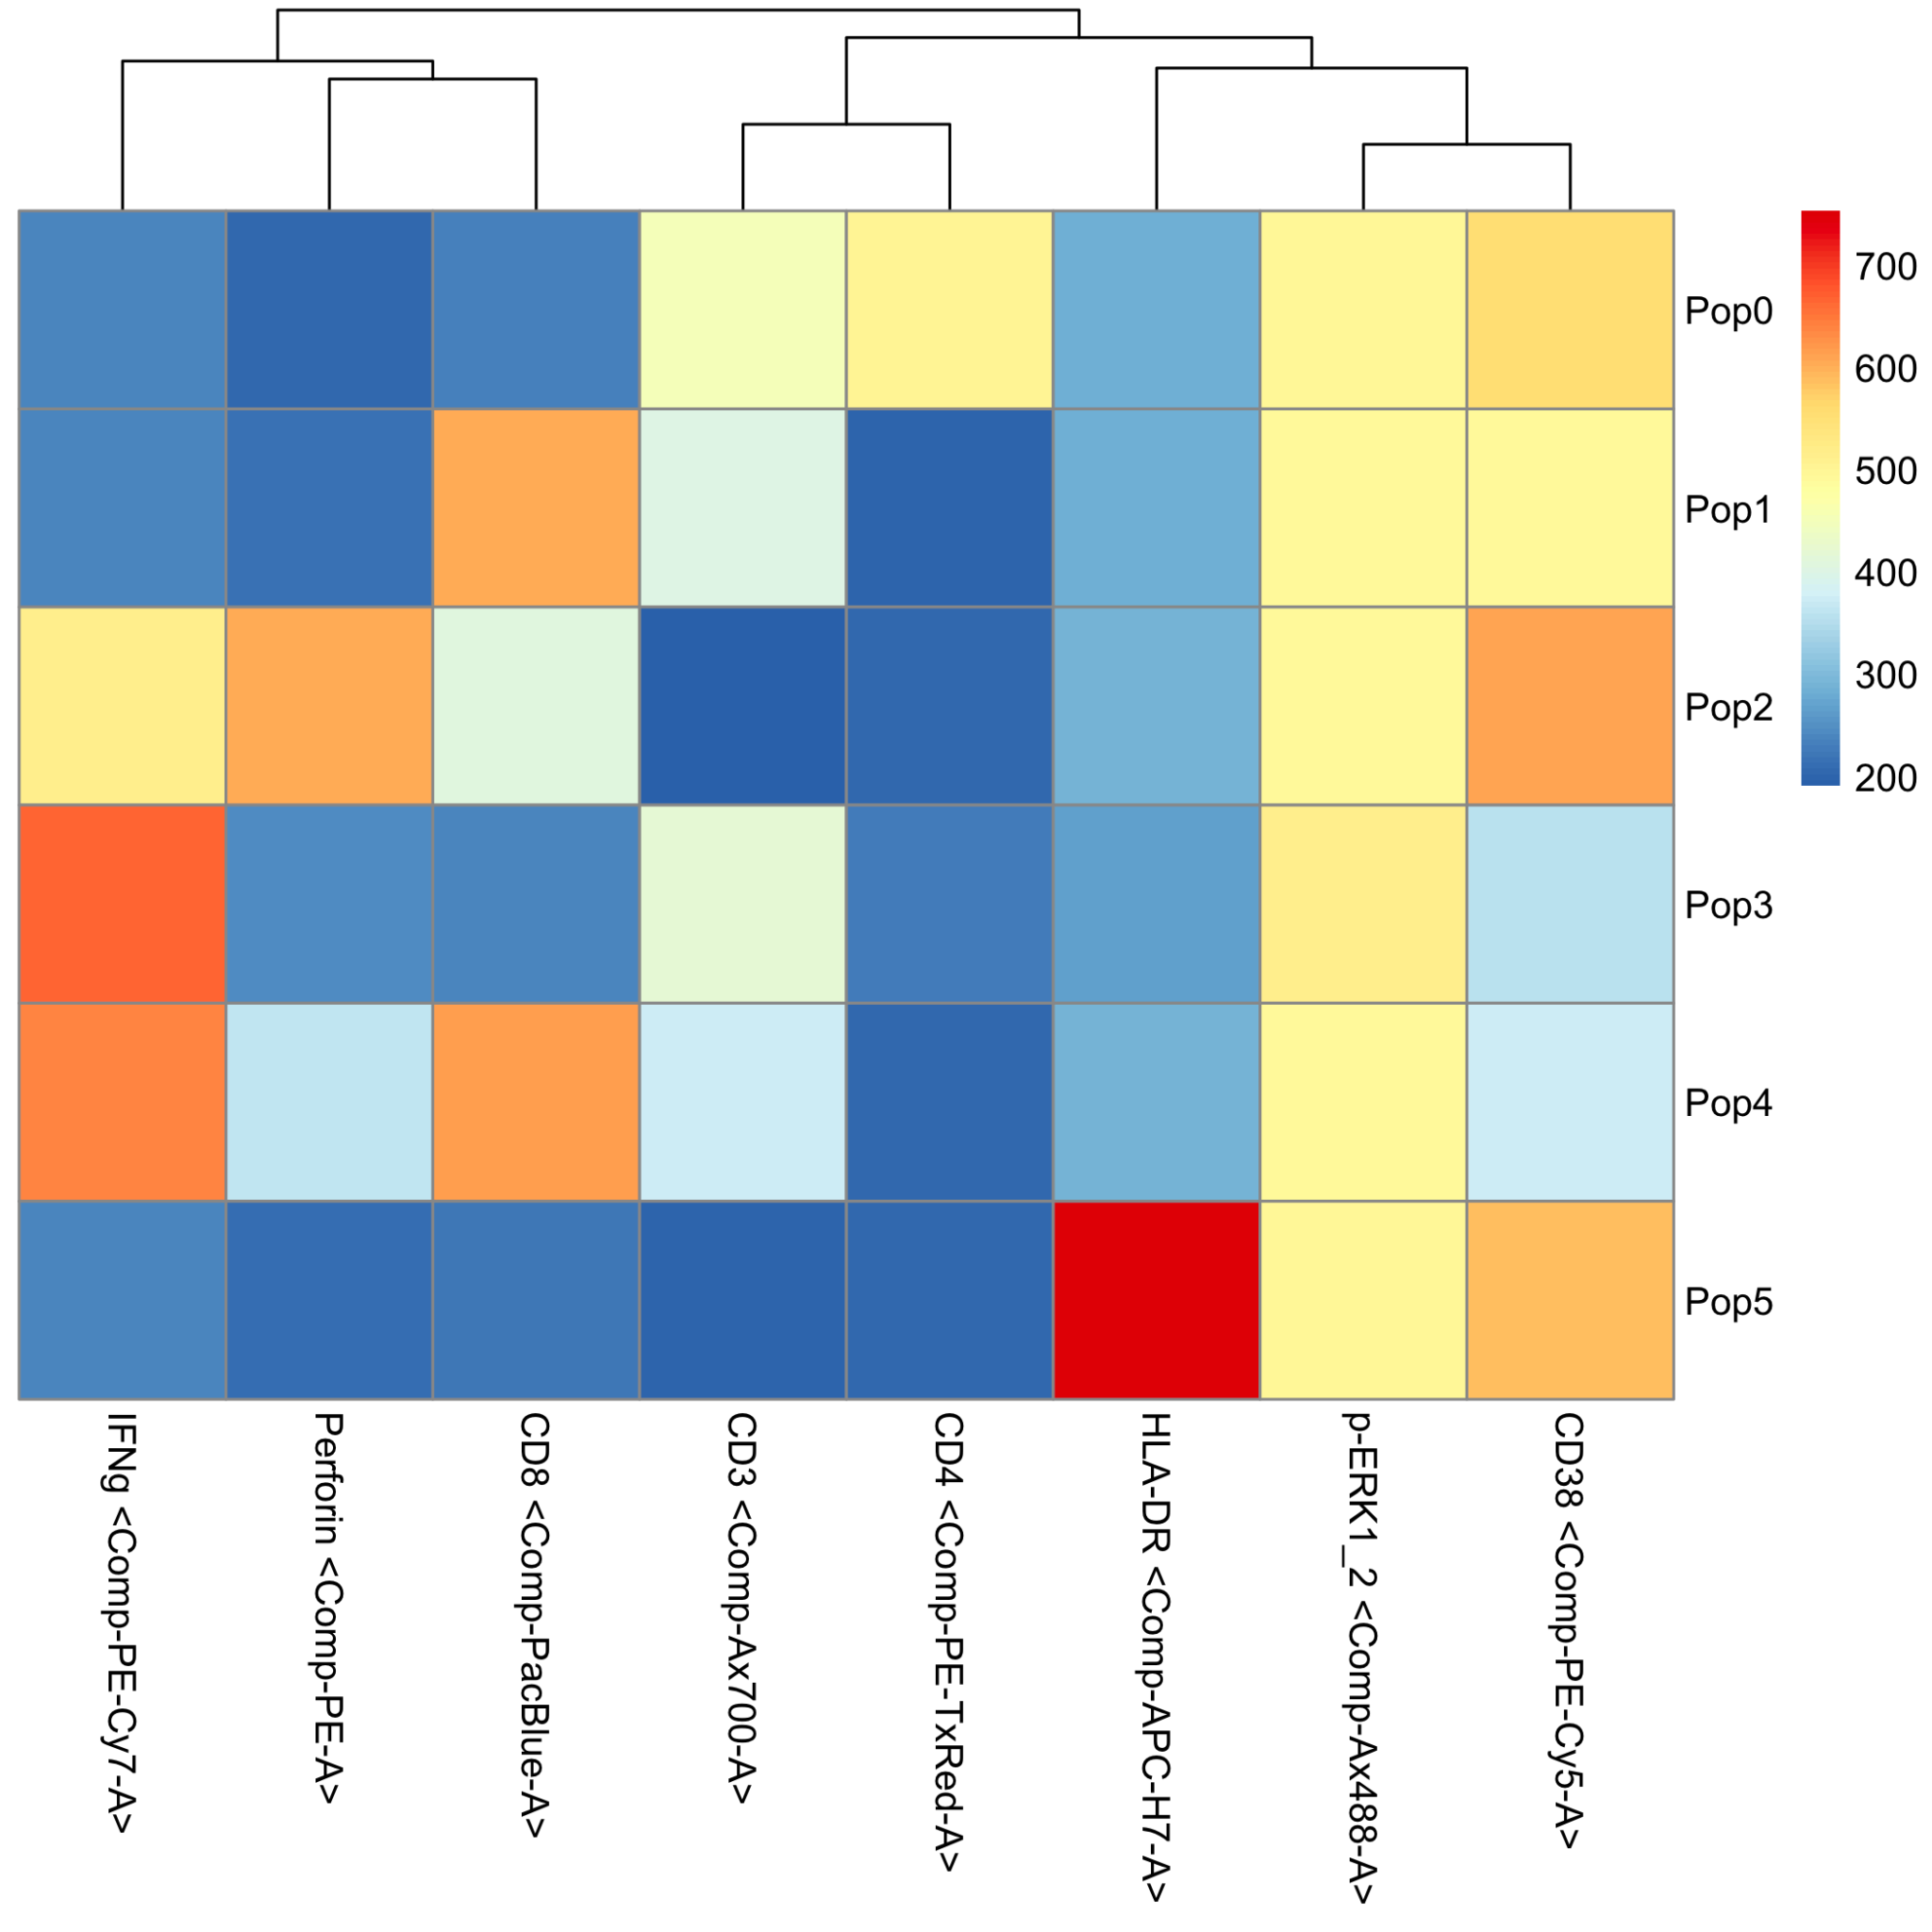
The heatmap image files can also be found in the location of the saved workspace within the FlowSOM folder.

Plugin Derivative Files
Most FlowJo Plugins create output files and write them do a folder in your Workspace’s folder. In that folder, you will find a list of CSV, PDF, PNG files, text, RData, and R files.
The runnumber.pdf and runnumber.png files both are images of the FlowSOM minimum spanning tree. This minimum spanning tree displays the FlowSOM clusters and displays the relationship of the clusters to each other by the relative distance between the clusters. Similar clusters will be near each other whereas unique clusters will be further separated from the other populations. The color surrounding the individual clusters represents which meta-cluster the individual clusters belong to. Those meta-clusters correspond to the populations in the workspace. Each cluster is also comprised of a pie chart which displays the relative intensity of each parameter in that cluster.
The PopHm.pdf file is a heatmap of the FlowSOM metaclusters. This file displays the relative expression in each metacluster of each parameter used for the FlowSOM analysis. The heatmap includes dendrograms that show the relationships of each of the clusters, indicating which clusters are similar to each other.
The ClHm.pdf file is a heatmap of the FlowSOM clusters. This heatmap is similar to the metacluster heatmap, except it shows information about each of the individual clusters that comprise the metaclusters.
The cllabels.pdf file is a map labeling the cluster numbers of the populations in the minimum spanning tree. This makes it easier to compare the populations in the minimum spanning tree to the cluster heatmap.
The PopLabels.pdf file is a map labeling the meta-cluster numbers of the populations in the minimum spanning tree. This helps indicate which metacluster each cluster belongs to in the minimum spanning tree. This is similar to the color coded information given when looking at the minimum spanning tree.
The PopMFI.csv file is a data table displaying the relative MFI for each of the parameters in each of the metacluster populations. Note: these values represent the transformed FlowJo data, so rather than directly representing the raw intensity values these values range from 0 to 1024. The raw MFI of each population can be found in FlowJo by applying that statistic to each of the clusters.
The ClMFI.csv file is a data table displaying the relative MFI for each of the parameters in each of the individual clusters that comprise the metaclusters. Note: these values represent the transformed FlowJo data, so rather than directly representing the raw intensity values, these values range from 0 to 1024.
The flowsom.pop.EPA.csv file is the file that stores the FlowSOM clustering information that is read by FlowJo. FlowJo will automatically use this file to create the derived “FlowSOM” parameter in the workspace. If FlowJo ever gets disconnected from the FlowSOM analysis, this file can be drag and dropped onto the sample file to re-apply the analysis.
Leave us your feedback
Please write to flowjo@bd.com or seqgeq@bd.com with any questions or concerns.
Source code
This plugin is open source, the source is contained as a ZIP file in the download from the FlowJo Exchange.


