Introduction
PhenoGraph is a clustering algorithm that robustly partitions high-parameter single-cell data into phenotypically distinct subpopulations. First, it constructs a nearest-neighbor graph to capture the phenotypic relatedness of high-dimensional data points and then it applies the Louvain graph partition algorithm to dissect the nearest-neighbor graph into phenotypically coherent subpopulations.
The PhenoGraph algorithm has been implemented as a plugin compatible with both FlowJo and SeqGeq analysis programs. As a result, this plugin will produce distinct subpopulations based on a derived “phenograph cluster number parameter”.
Please review FlowJo documentation for installing plugins.
Download and installation
1. Place the plugin .jar file in your Plugins folder, and direct FlowJo or SeqGeq to that folder using the Diagnostics section of the Preferences.
2. Restart the (FlowJo or SeqGeq) application to pick up the new plugin Note This Phenograph plugin was implemented in Python native on Mac OS10.12+ and Windows 10. It does not require installing Python, R, Rtools or XQuartz in order to run.
Usage
To run the PhenoGraph plugin on a population (or sample),
1. Select the population of interest within the workspace
2. Go to the Workspace tab and select the PhenoGraph option from within the Plugins dropdown there.
Note that plugin will be unavailable (greyed out) if no population is selected.

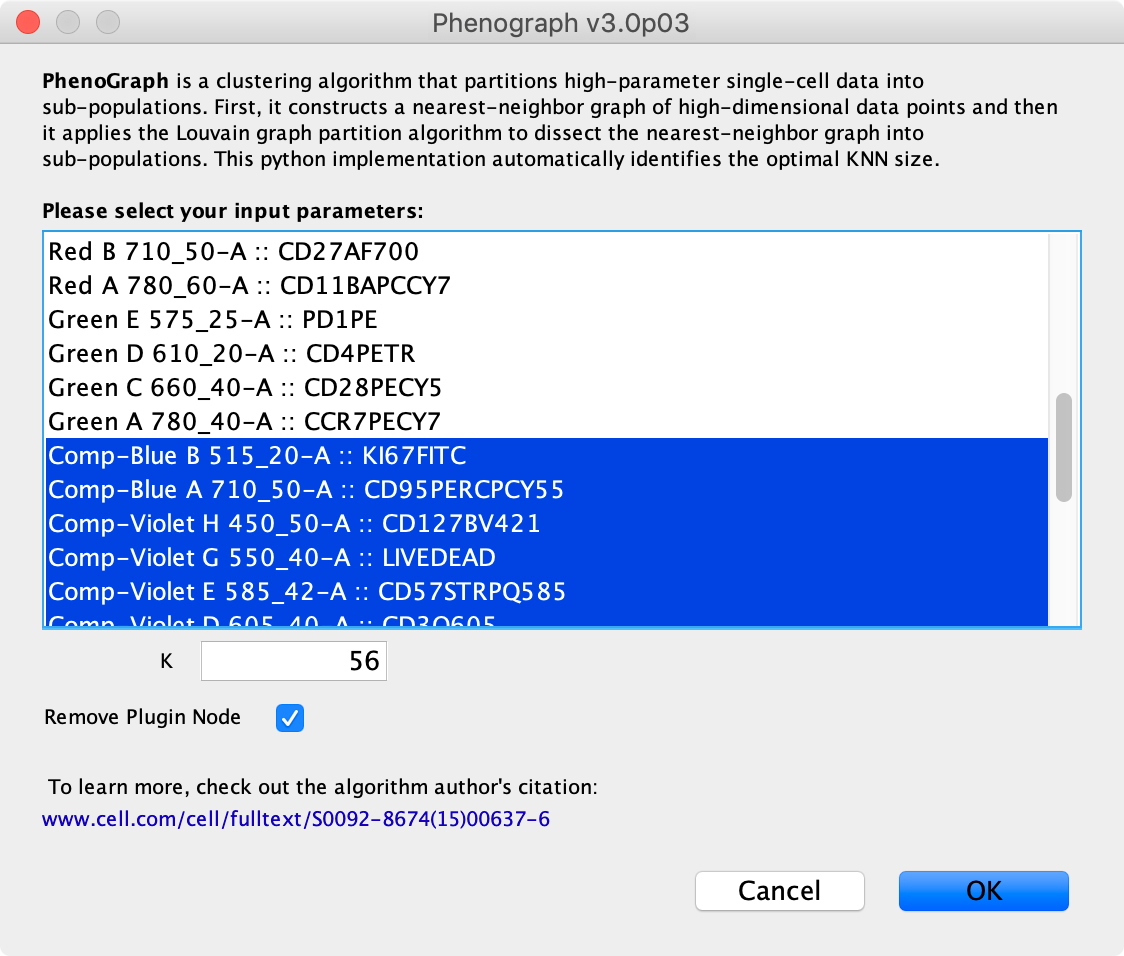
3. Select the parameters and settings that you would like to use to run the PhenoGraph algorithm within the resulting plugin dialog:
- Parameter Selector Which input parameters, such as FCS channels in FlowJo, principal components or genes or transcripts in SeqGeq, do you want to run the algorithm on.
- K: The number of nearest neighbours to be used for the nearest-neighbor graph to capture the phenotypic relatedness of high-dimensional data points. According to the original paper, Phenograph isn’t typically very sensitive to this parameter as long as the values are reasonable. The Phenograph plugin will by default try to estimate a K value appropriate for the selected population. The authors have shown good results for K between 15 and 60 whe clustering healthy immune cells, see figure 2B in Levine et al., 2015.
- Remove Plugin Node: If this is selected it will remove the node used for the plugin calculation after it finishes calculating. It is a good idea to remove this to prevent the plugin from recalculating.

4. Once the plugin has finished calculating, it will create a new parameter capturing the PhenoGraph cluster ID along with gates dissecting the input population (sample) into distinct subpopulations as clustered by PhenoGraph. In addition, PhenoGraph will display the resulting modularity. Modularity is a value between -1 and 1 that is used as a score for the quality of the graph partitioning. Formal definition of modularity is in Newman and Girvan, 2004.

Leave us your feedback
Please write to FlowJo@bd.com or SeqGeq@bd.com with any questions or concerns.
References
1. Levine et al. Data-Driven Phenotypic Dissection of AML Reveals Progenitor-like Cells that Correlat with Prognosis. Cell 162, 184–197, July 2, 2015, Elsevier Inc. http://dx.doi.org/10.1016/j.cell.2015.05.047
2. DiGiuseppe et al. PhenoGraph and viSNE facilitate the identification of abnormal T-cell populations in routine clinical flow cytometric data. Cytometry B Clin Cytom. 2017 Sep 2. doi: 10.1002/cyto.b.21588.
3. Newman and Girvan. Finding and evaluating community structure in networks. Physical Review E 69(2 Pt 2):026113 March 2004, DOI: 10.1103/PhysRevE.69.026113. https://arxiv.org/abs/condmat/0308217
