Introduction
flowCut is an R based algorithm is a tool for separating quality events in FCS data from outlier events to achieve a more uniform distribution of data over the time of acquisition. This tool can be used to address data quality issues that may occur during acquisition, such as clogs, or other anomalies. The flowCut algorithm will remove cells contained in segments with low density or that are substantially different from the rest of the segments across the time of collection. flowCut evaluates the data using eight measures: mean, median, 5th, 20th, 80th and 95th percentile, second moment (variation) and the third moment (skewness). The density of the sum of these measures is calculated for each segment and each parameter chosen to be considered. This generates a density plot describing the quality of each segment of cells. This distribution is then used to determine the outlier cells to be removed by the algorithm.
Additionally, the files are evaluated with the following four checks.
1. Not monotonically increasing in time
2. Sudden changes in fluorescence
3. Larger gradual change of fluorescence in all channels
4. Very large gradual change of fluorescence in one channel.
Images produced by the algorithm will contain four letters of either “T” or “F” indicating whether the sample passed (T) or failed (F) each of the tests, corresponding to the order of the tests as presented in the list above.

More information about flowCut can be obtained by reading the original paper here:
Meskas J, Yokosawa D, Wang S, Segat GC, Brinkman RR. flowCut: An R package for automated removal of outlier events and flagging of files based on time versus fluorescence analysis. Cytometry. 2023; 103(1): 71–https://doi.org/10.1002/cyto.a.24670
Additional information is also available in the flowCut vignette here:
https://bioconductor.org/packages/release/bioc/vignettes/flowCut/inst/doc/flowCut.html
Installing flowCut
If you are new to FlowJo Plugins, we recommend reviewing this documentation for installing FlowJo Plugins.
Basic instructions for installation:
1) To use the flowCut plugin, you will need FlowJo 10.9.0 or newer.
2) Download flowCut from our website.
3) Unzip the download folder and place the “flowCut.jar” file into the Plugins folder.
4) Make sure that R version 4.3 or newer is installed on the computer and that the R path and plugins folder path are set in the “Diagnostics” section of the FlowJo Preferences (heart icon). Review our additional documentation for more information on how to install R.

5) The first time you run flowCut, it will download and install the dependencies it requires in R 4.3 or newer.
a) These can be also be manually installed in your R by typing the following in your console:
if (!requireNamespace(“BiocManager”, quietly = TRUE))
install.packages(“BiocManager”)
BiocManager::install()
BiocManager::install(c(“flowCore”, ”splancs”, “flowCut”))
6) Restart FlowJo and a FlowCut option should be available in your “Plugins” dropdown menu in the workspace tab.

Using flowCut
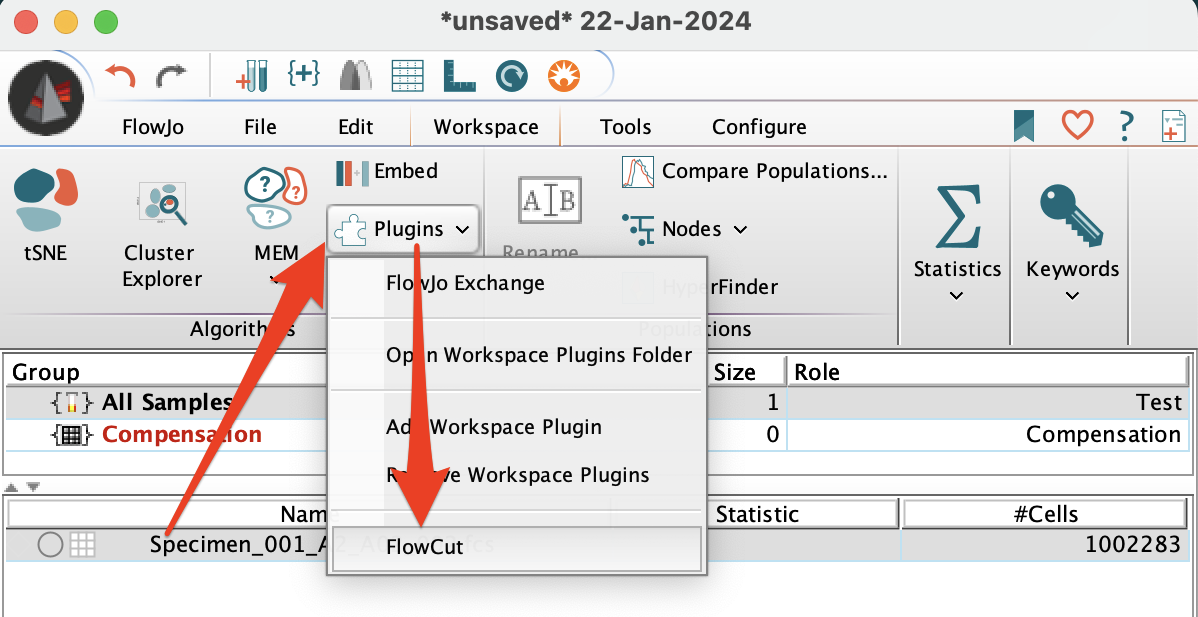
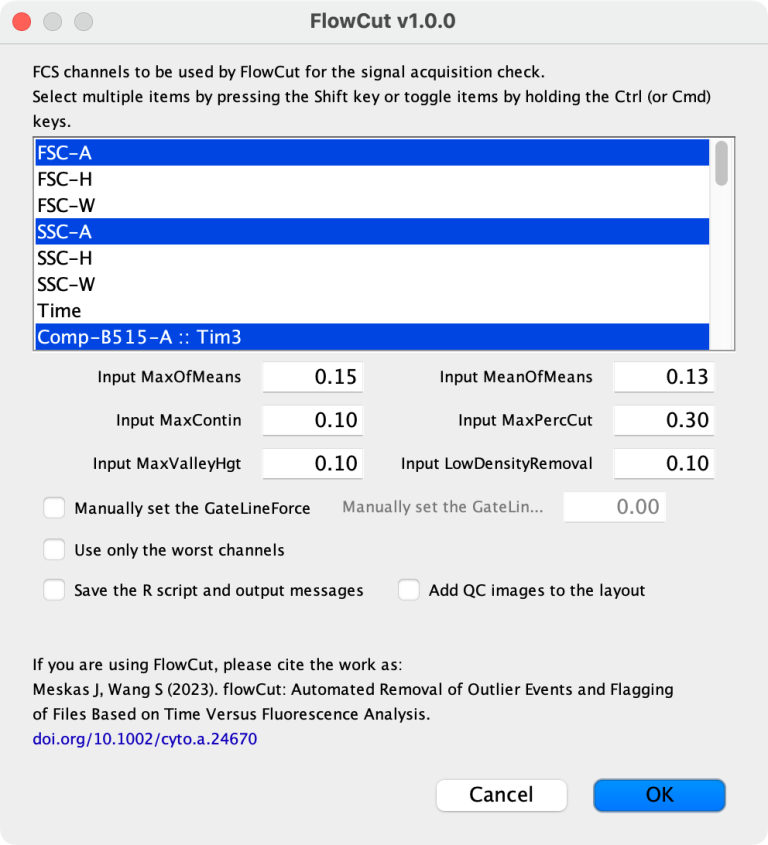
To run the flowCut algorithm, first select a sample in the workspace. Then click on the “Plugins” dropdown menu under the “Workspace” tab and select flowCut. This will open a new window to input settings for the flowCut algorithm. Select the parameters to be considered (required) and adjust the tunable settings as desired (optional).
Each of the variables and options available in flowCut are described in detail further below. Press “Ok” to run flowCut on the FCS.

The plugin node will say “Calculating” indicating that the algorithm is running in R. Once the algorithm finishes, it should return a “FlowCutGoodEvents” and “FlowCutBadEvents” population. The “FlowCutGoodEvents” population contains the regular events for further analysis. The “FlowCutBadEvents” population contains the irregular events removed by the algorithm. The algorithm will also return a “a/b flowCut” derived parameter which saves the information about the results for this sample. The “FlowCut” node can be drag and dropped onto other samples or a group of samples to run the analysis on other samples using the same settings.

Please note that is not appropriate to run flowCut on a subpopulation. Typically, flowCut and other cleanup algorithms are used before any gating is performed.
The plugin will also generate an image, which can be loaded into the layout. The image has a few qualities. First, the images produced by the algorithm will contain four letters in their name, either “T” or “F” indicating whether the sample passed (T) or failed (F) each of the following tests in order:
1. Not monotonically increasing in time
2. Sudden changes in fluorescence
3. Larger gradual change of fluorescence in all channels
4. Very large gradual change of fluorescence in one channel.
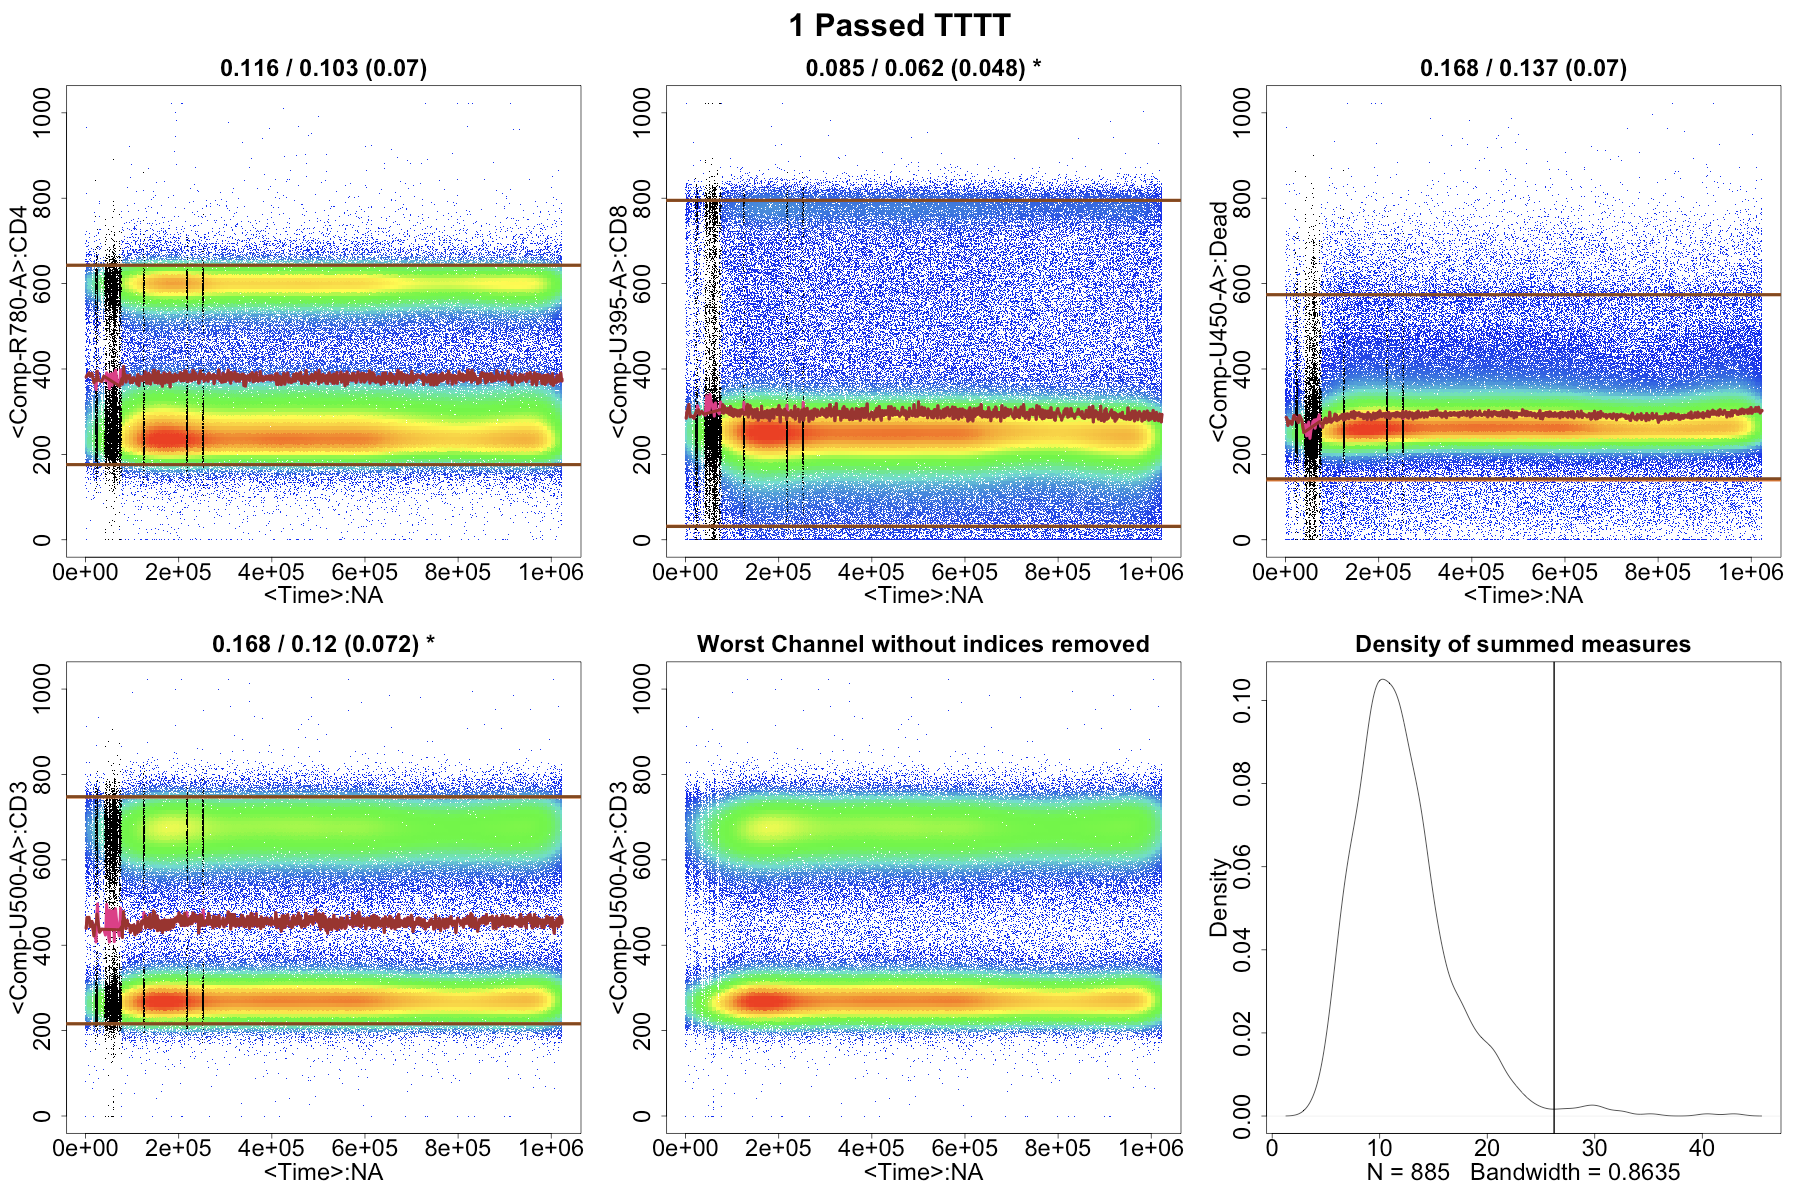
For example, in the image below the results are “TFFF” indicating that the sample passed the 1st check but failed the 2nd, 3rd and 4th check.

The image displays each parameter selected for the flowCut algorithm over the time of acquisition. Visually, we are able to see spikes and drops that indicate abnormalities that should be removed by flowCut. Areas of low density (density less than the “LowDensityRemoval” parameter) are colored grey and have been labeled “BadEvents”. The top and bottom dark brown lines indicate the 98th percentile and 2nd percentile of the data after cleaning. The light brown lines represent the 98th percentile and 2nd percentile before cleaning. Often, these lines will overlap because there is not much variation in the percentiles before and after cleaning. The brown line in the middle connects the means of each time segment. When the brown line turns pink it indicates that the segment has been removed by
the flowCut algorithm.
At the top of most plots are a series of numbers. The first number indicates the mean drift before cleaning, the second number represents the mean drift after cutting and the third number in parenthesis represents the max one step change after cutting. The second to last plot displays the worst channel over time. The last plot is a density of summed measures plot showing a sum of the 8 metrics that flowCut evaluates. Segments that deviate more will have a higher sum of their metrics and will be located on the right side of the density plot. The line indicates the cutoff point set by the algorithm, any data segment to the right of that point is labeled as “BadEvents”.
Variables and Options
Below is a list of variables that can be adjusted within flowCut.
Input MaxOfMeans
The threshold of the average mean drift across all channels. Decreasing this value will increase the strictness of the algorithm.
The Mean Drift is a measure of the quality of a given channel across all of the segments and is calculated using the mean of each of the segments with the following equation:

Input MeanOfMeans
The threshold of the average mean drift within the single channel with the highest range of means. Decreasing this value will increase the strictness of the algorithm.
Input MaxContin
The MaxContin accounts for any sudden spikes or drops in the data. A change in the mean between segments that is greater than the value set in the MaxContin will cause the segment to get flagged as a “BadEvent” segment.
Input MaxPercCut
The maximum percentage of events flowCut will remove as “BadEvents”. FlowCut will try to avoid setting a gate on the density of summed measures plot that would remove more cells than the specified “MaxPercCut”. Note, it can still sometimes remove more cells than the MaxPercCut.
Input MaxValleyHgt
The maximum density that flowCut will select for its cutoff point in the density of summed measures plot. This is the highest point on the Y axis of the density of summed measures plot that flowCut is able to choose as the cutoff point on the X axis.
Input LowDensityRemoval
The minimum percentage that cells must reach in the density distribution of the data. Any cells located below this threshold are removed before the other checks are performed.
Manually set the GateLineForce
Allows the user to specify the location on the X axis that the cutoff line is set on the density of summed measures plot. It is not suggested to set this parameter unless flowCut has already been run and the density of summed measures plot has been closely inspected.
Use only the worst channels
Turning on this option will cause the algorithm to only evaluate the worst channels with the most outliers, ignoring the other channels.
Save the R scripts and output messages
This saves the R script used to run the flowCut algorithm. This script can be opened in R.
Add QC Images to the layout
This option will cause FlowJo to automatically load the QC image into the layout when the algorithm finishes.

Leave us your feedback
Please write to flowjo@bd.com with any questions or concerns.
