Introduction
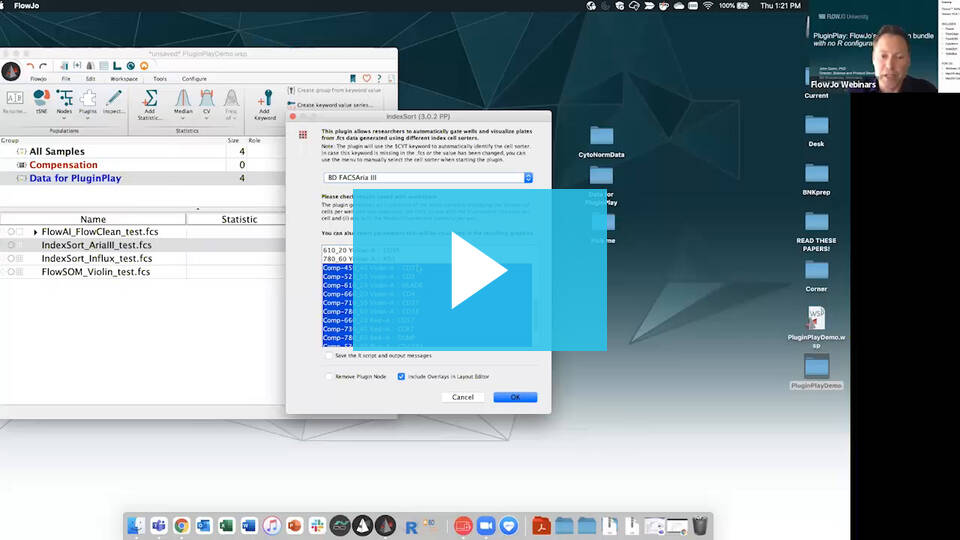
This plugin was designed in order to give researchers the ability to automatically gate wells from .fcs data generated using the BD FACSAriaTM, the BD FACSAriaIITM, the BD FACSAriaIIITM, the BD FACSAria FusionTM, the BD FACSMelodyTM, the BD Influx SystemTM, the BD FACSJazzTM, FACSVulcanTM, and the BD FACSymphonyTM S6 cell sorters.
Please review FlowJo documentation for installing plugins.
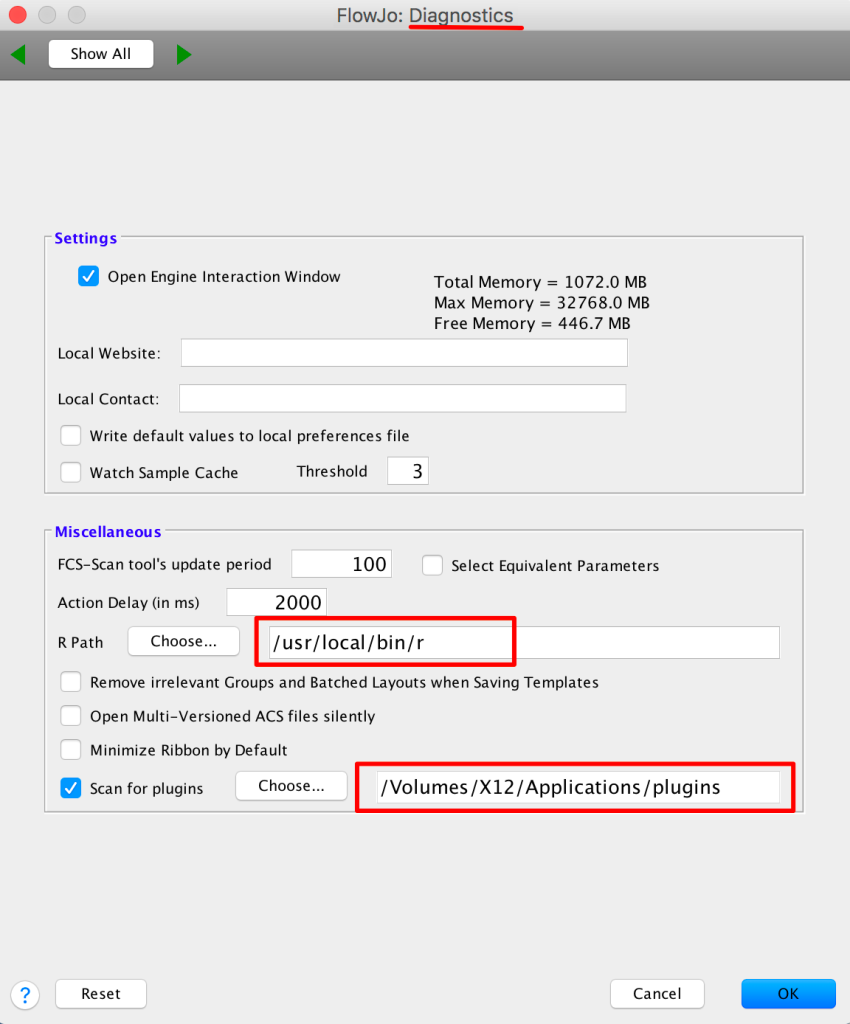
1. Place the plugin .jar file in your Plugins folder, and direct FlowJo to that folder using the Diagnostics section of the Preferences.
2. Make sure you have R installed and the R path is specified in the R Path field of the Diagnostics section of the Preferences.
3. When the plugin is run for the first time, it will auto-install the required R packages. The R libraries can be manually installed by typing (or copy/pasting) the following in your R console:
if (!requireNamespace("BiocManager", quietly = TRUE))

install.packages("BiocManager")

BiocManager::install()

BiocManager::install("flowCore")

install.packages("tidyverse")
Note: For older versions of R, please refer to the appropriate Bioconductor release.
4. Restart the FlowJo application to pick up the new plugin.
Usage
To run the IndexSort plugin on your FCS file,
1. Select the index sorted .fcs data file you’d like to use with the plugin.
2. Go to the Workspace tab and select the IndexSort option from within the Plugins dropdown there.
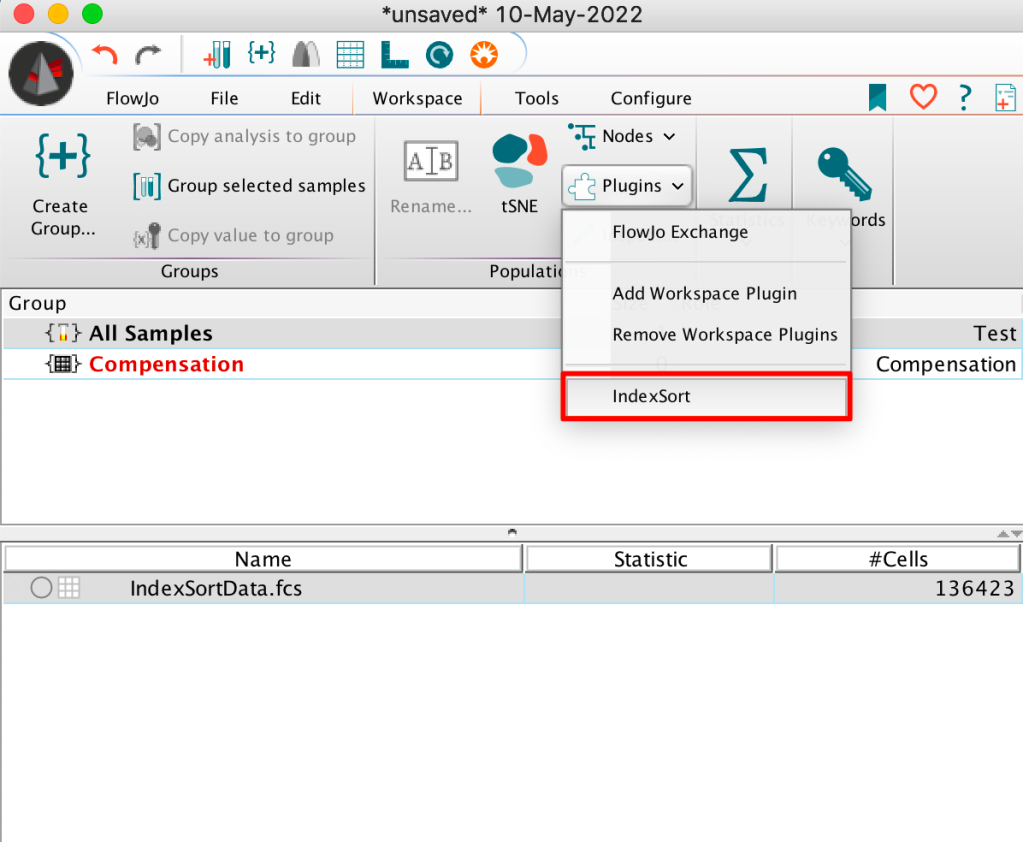
Note that plugins will be unavailable (greyed out) if no file is selected.
3. This will bring up a dialog where researchers can choose from the menu which cell sorter was used for their data file.
Note: The plugin will try to use the $CYT keyword to automatically identify the cell sorter. In case this keyword is missing in the .fcs or the value has been changed, you can use the menu to manually select the cell sorter when starting the plugin.
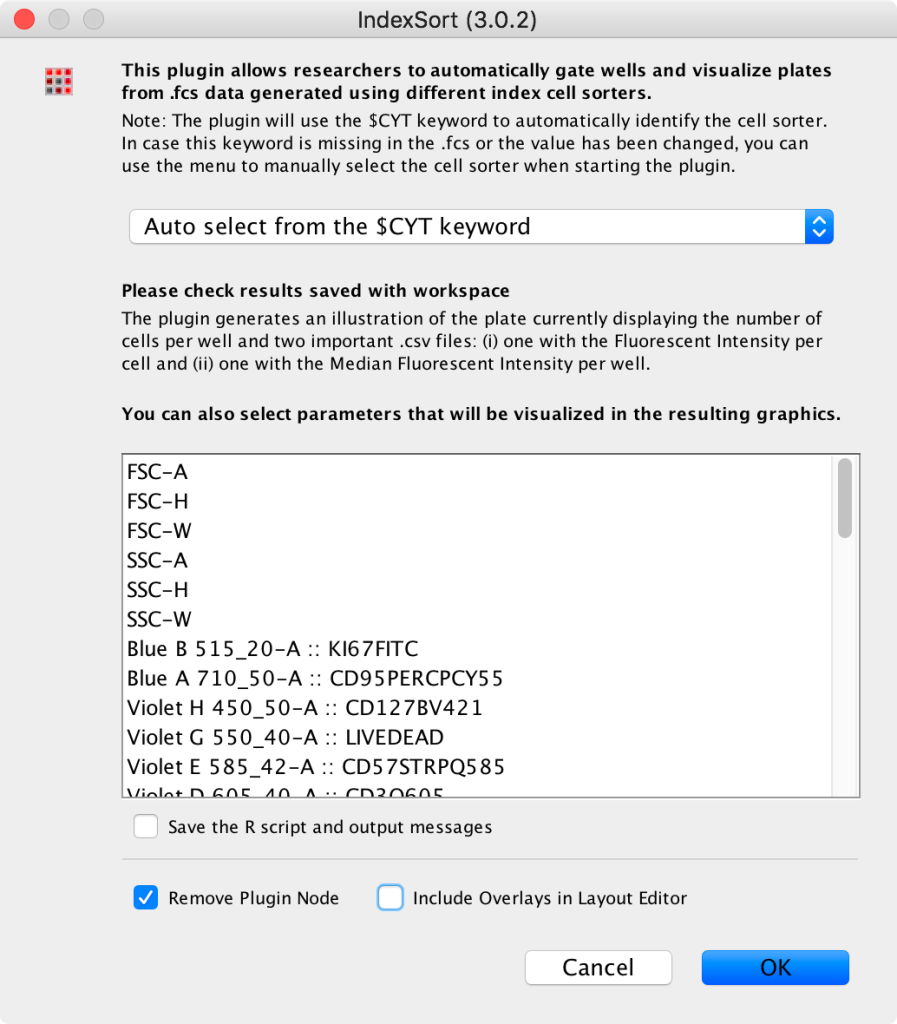
4. After calculations are completed the plugin will generate derived parameters corresponding to the X and Y axes of your plate (IdxRow and IdxCol), and automatically return gates for each row of that sort, and sub-gates for each column of each row.
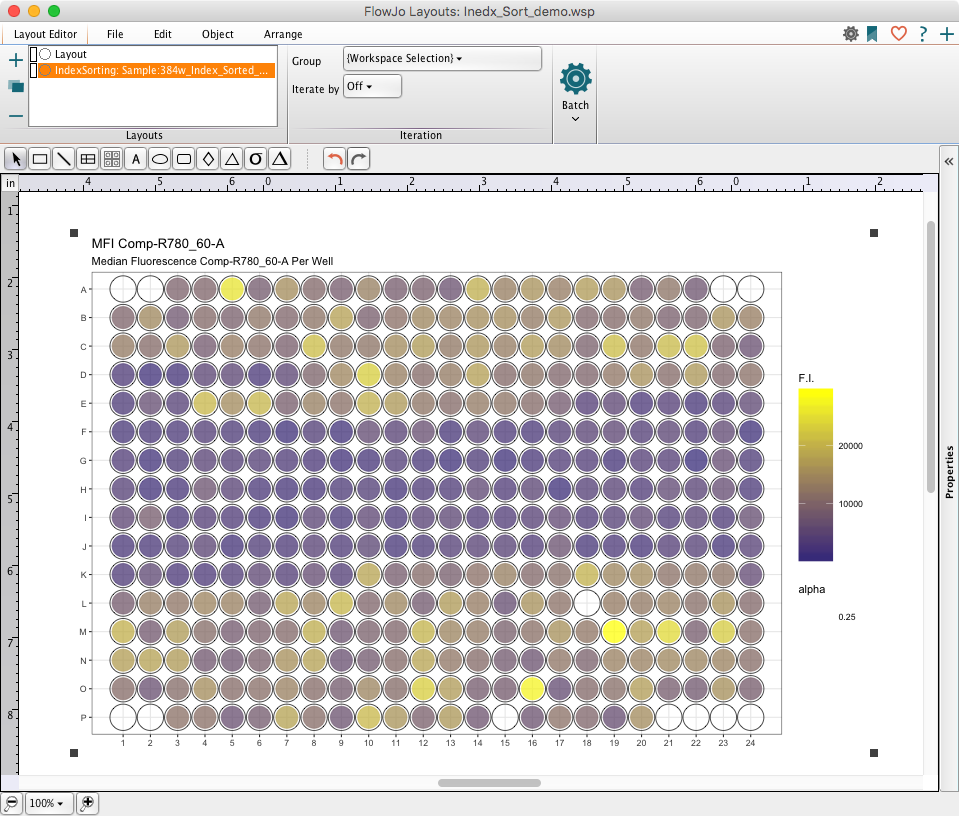
Additionally, the plugin generates a set of illustrations that automatically get added to the Layout Editor. The first image is of the plate showing the number of cells per well, while the other plots will display the Median Fluorescent Intensity per well for the Parameters selected from the plugin dialog window.
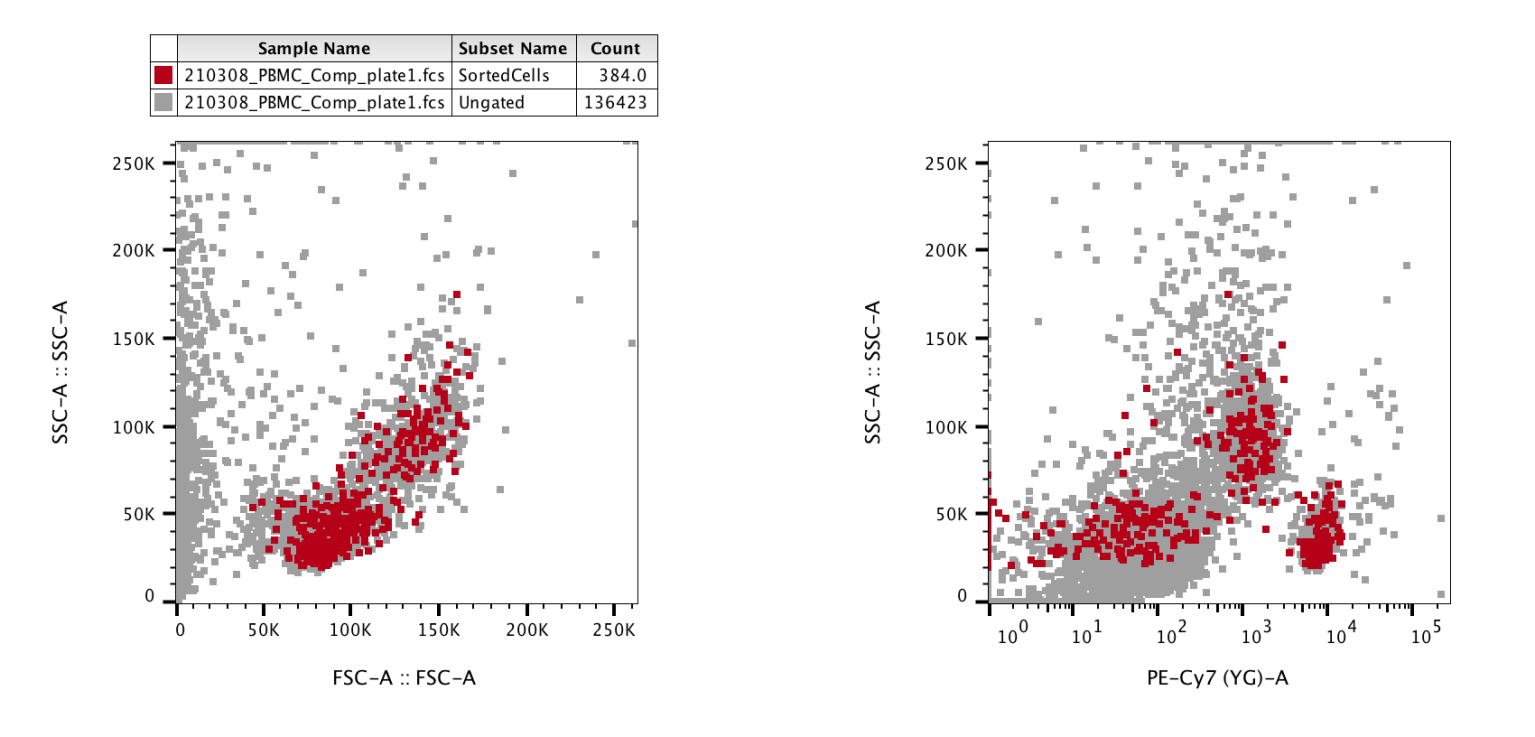
5. Selecting the “Include Overlays in Layout Editor” option will create additional images in the layout editor overlaying the sorted cells onto the entire sample population to visualize the regions where the sorted cells were present.
Leave us your feedback
Please write to flowjo@bd.com with any questions or concerns.

