Introduction
The PHATE algorithm has been developed and implemented as a Python package by Kevin R. Moon, David van Dijk, Zheng Wang, Scott Gigante, Daniel B. Burkhardt, and Jay Stanley, out of the Krishnaswamy Lab at Yale University.
PHATE (Potential of Heat-diffusion for Affinity-based Trajectory Embedding) is a dimensionality reduction method that can be used for visualizing your high dimensional data in fewer dimensions. PHATE is able to preserve both local and global relationships between data-points to accurately reflect the high dimensional data.
There are three main steps to PHATE algorithm. First, a square matrix is computed of the Euclidean
distances of each cell. Cells that are short distances apart would show similar gene and/or protein expression measurements and are considered as similar cell types, whereas cells further apart would show very different expression patterns and be considered as very different cell types. These distances are then converted into affinities, which quantify local similarities between the observations and help to preserve local structure in the data. These affinities are inversely proportional to the Euclidean distances; the further apart two cells in Euclidean distance, the smaller their affinity, and vice-versa. To help preserve the global structure of the data, the next step is to use a diffusion map to first transform the local similarities into probabilities that measure the probability of moving from one data point to another in a single step of a random walk. This repeats and walks through an area of high affinity data (from cell to cell) where each possible step has a defined probability of going down a path to an area with lower affinities. Finally, the potential distance matrix is embedded into two or three dimensions using metric Multidimensional Scaling (MDS) which is tailored from distance matrices and helps to produce a very informative embedding.
For more information on the PHATE algorithm, please see their paper: Moon, K.R., van Dijk, D., Wang, Z.
et al. Visualizing structure and transitions in high-dimensional biological data. Nat Biotechnol 37, 1482–1492 (2019). https://www.nature.com/articles/s41587-019-0336-3
Usage
As a Python based plugin, the “PHATE.jar” file is all you need to allow the plugin to run automatically
without the need to install external dependencies on Windows 10 and modern Mac OS.
To run the plugin:
1. Place the “PHATE.jar” file into your plugins folder.
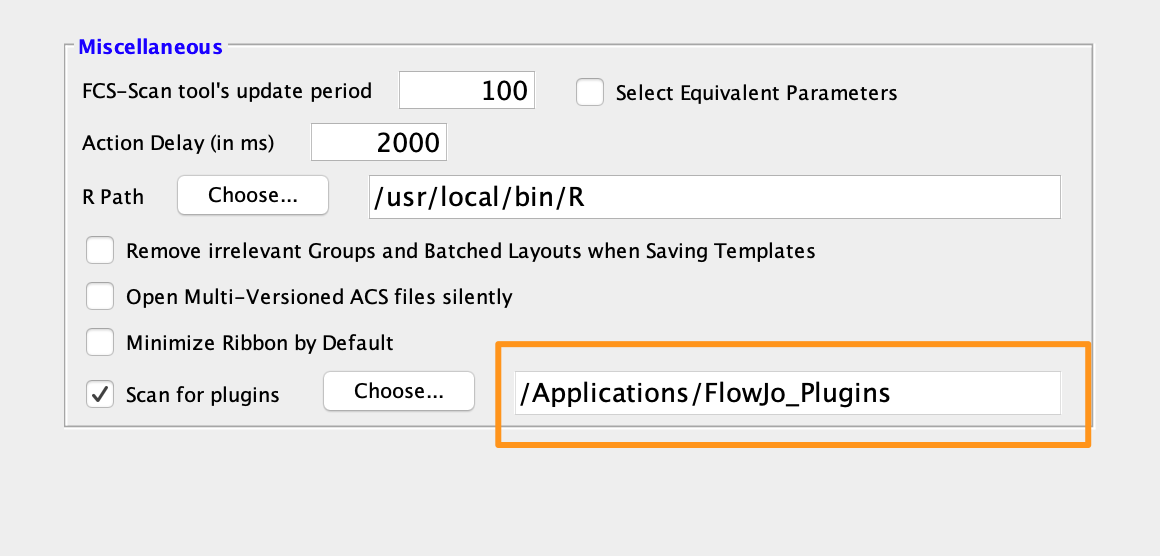
2. Point FlowJo or SeqGeq to your plugins folder (also in the Diagnostics preferences):

3. Restart FlowJo or SeqGeq.
4. Within the workspace samples area, select the population of interest (for embedding).
5. Within the Workspace tab of the workspace, select the Plugins option, and choose “PHATE”:
6. This will launch a plugin dialog, all Comp- prefixed parameters will be selected initially, and default settings applied. Choose any subset of parameters that you want to be considered for dimensionality
reduction and adjust settings as desired.

Notes
Parameters: All Comp- prefixed parameters will be selected initially. Choose any subset of parameters
that you want to be considered for dimensionality reduction.
Distance Metric: Use the drop down menu to choose a distance metric.
Nearest Neighbors: The number of nearest neighbors according to the distance metric.
Decay: Set the decay rate of kernel tails. Decreasing decay increases connectivity on the graph, increasing decay decreases connectivity.
Gamma: Choose the gamma value for PHATE. This information distance constant be can set from -1.0 to 1.0. Gamma=1 gives the PHATE log potential, gamma=0 gives a square root potential.
Number of Components: The number of dimensions to return (2 or 3).
Batch Correction: Select this box to perform MNN batch correction before embedding.
Batch ID: When performing batch correction, select the user-defined keyword in the concatenated file that identifies the batches (FlowJo). SeqGeq will automatically use the ‘SampleID’ keyword in the concatenated file.
By running the tool, a new set of PHATE parameters should be generated as a CSV file within the plugin
derivatives folder, and that information will be merged into the current workspace, automatically.

Figure 1: Comparison of Barnes-Hut t-SNE, UMAP and PHATE embeddings on 17 color flow cytometry
data.
Leave us your feedback
Please write to flowjo@bd.com with any questions!
References
Moon, K.R., van Dijk, D., Wang, Z. et al. Visualizing structure and transitions in high-dimensional
biological data.
