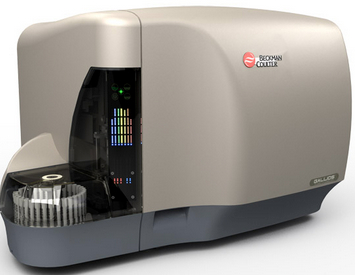
Gallios currently uses CXP software
Beckman-Coulter Gallios produces LMD files that contain an FCS 3.0 compliant portion. They display the data as collected, if “True View” is used. If standard view is used, linear parameters are scaled 1-1024 and log parameters to four decades with a range of 1-1024. This is a display similar to FCS 2.0 data. Preferences in FlowJo control the scaling of the exported FCS 3.0 file. Data can be scaled identical to their acquisition display in true view OR standard view.
We recommend that you use the Trueview (3.0) format. The visualization will be slightly different than the standard 4 decade scale (fcs2.0) you may be used to*, but the benefits of using the full data range, digital compensation matrix, and transformation settings far outweigh using the fcs2.0 portion.
*Remember that scaling is arbitrary and relative to the system. Controls are used for standardization. Fluorescence is a relative measurement.
FlowJo instructions for formatting your plots to match CXP/MXP/Gallios
- Drag and drop data in. Double click on the file to open a Graph Window.
- Select the desired parameters using the axis drop down menu. Note: These software display bin number for scatter parameters, while FlowJo displays intensity. The appearance is unchanged.
- Click the T-button on the axis, select “Change Displayed Parameter Range” and type in minimum and maximum axis values to match the acquisition software. Click OK.
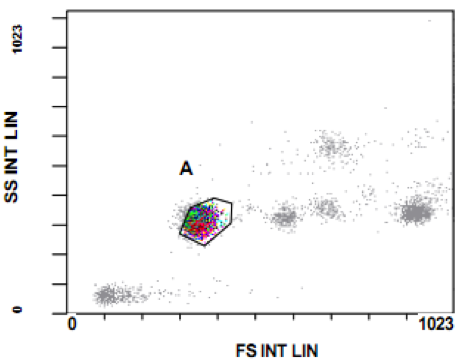
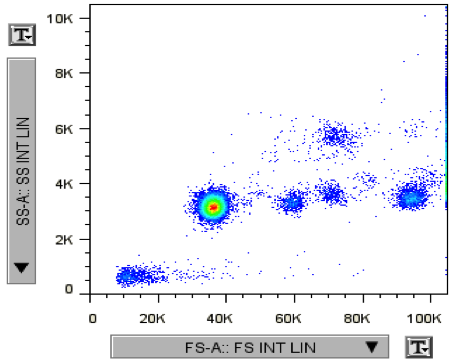
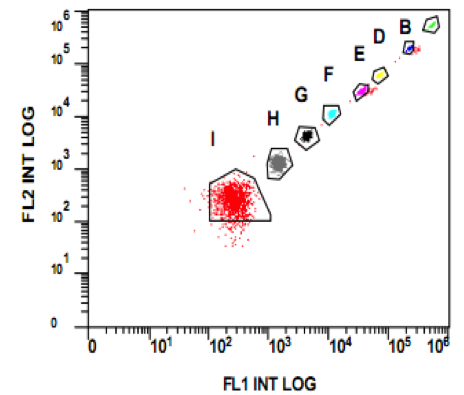
Below are examples of data as it appears in CXP and the same data in FlowJo
CXP – Gallios in Standard (fcs2.0) view

FlowJo reading fcs2.0 portion of LMD file

CXP – Gallios in Standard (fcs3.0) view

FlowJo reading fcs3.0 portion of LMD file

