
MoFlo XDP and MoFlo Astrios – Summit v6+
Summit produces FCS 3.0 compliant files that can be used with FlowJo. The data will look identical with the default settings, but the scale on the scatter parameters will be reported differently compared to the display on Summit. Summit appears to display data binned down to 256 bins for scatter parameters though it records and exports the full 32-bit (2^32) range, which is what FlowJo displays.
To control how the data will be scaled in FlowJo, the preferences can be used prior to loading. Preferences are accessed using the heart in the upper right-hand corner of the workspace, and shown in Figure 1.

Figure 1
When you drag a file from a particular cytometer into FlowJo the cytometer will appear in the Cytometers tab of the preferences thereafter, sorted by the $CYT keyword. Figure 2 shows the Cytometers preference tab opened, with the MoFlo XDP selected.

Figure 2
The default settings will make the data look as it does on the acquisition software, but by unchecking any of boxes preceeding the scale you can modify the default to fit your routine data. One element that is useful to change is the transformation. Summit does not include a biexponential option which is the preferred way to view fluorescent parameters in flow cytometric data. You can enable the transform by checking the box highlighted by the leftmost arrow in the figure below. FlowJo will automatically transform MoFlo XDP data on load if you do so. Additionally, you may want to set the width basis to be something small to begin with, such as -10. The width basis is the number of bins on either side of 0 that will be displayed on a linear scale. A small value will most resemble log data, with the exception of expanding the view-able space to zero and below. In the example below, the effect of changing the transform is illustrated.
Figure 3 shows data collected on a MoFlo XDP and analyzed in summit juxtaposed by the same analysis as done in FlowJo.


Figure 3
For the fluorescent parameters in these plots I have displayed the version called ‘Comp-FLn-Log_Height::…’. Summit can export a variety of compensated and uncompensated versions of the parameters, but this seems to be the correct version. In the FlowJo graph window you can choose to either show or hide uncompensated parameters from the Display menu. FlowJo will show only compensated parameters and the uncompensated parameters for anything that does not have a compensated version. Hiding the uncompensated parameters can be useful for clearing up the display.
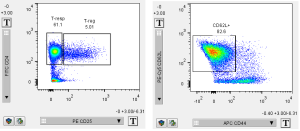
If you were to turn on the biexponential transform via either the preferences as mentioned above, or via the T-button, the two right-most plots above would become the plots in Figure 4. Notice how all the data is now visible on screen on a biexponential scale, whereas a log scale leaves some of the data pressed into the axis.

Figure 4
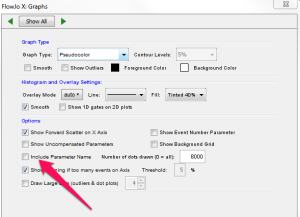
In the last two figures I also changed the Graphs preferences to not display the parameter name, so that the target alone is displayed. This may be helpful for properly viewing Summit produced data, as the parameter names are very long. Figure 5 shows this preference.

Figure 5
