The Nearest Neighbor Search in the CellView Lens plugin identifies similar cells based on numeric parameters and can create a population of those cells.
If you have used image sets to visually identify cells of interest, you may want to extend this set by including the most similar cells based on their measured or derived parameters. To use this tool, click the Find Similar Images button as shown in Figure 1.

Figure 1: Find similar images
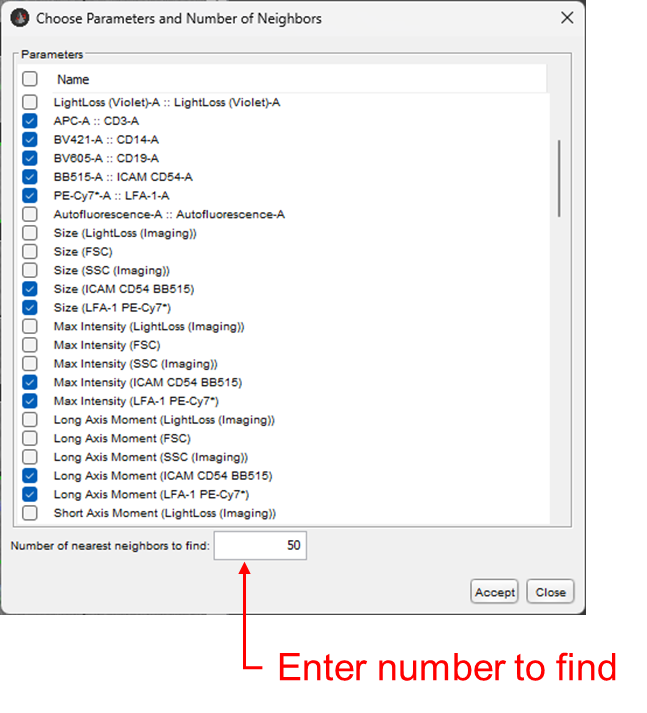
The dialogue box shown in figure 2 will appear, allowing you to select which parameters to use in identifying cells via K-nearest neighbors. Essentially, the algorithm will calculate the difference in parameter intensities between your selected cells and every other cell in the current population, using every parameter you choose, and then rank them from smallest difference to largest difference. The most similar cells are the ‘nearest neighbors’. You can enter a number of nearest neighbors to include in you image set via the text entry box at the bottom of the dialogue.

Figure 2: Nearest Neighbors dialogue
Importantly, K-nearest neighbors (KNN) does not automatically determine a threshold for what constitutes ‘nearest’. The algorithm simply returns the most similar images so you may want to start with a smaller number of similar images, or curate the set afterwards. Any image that you do not want in the image set can be removed by clicking on it and pressing the delete key on your keyboard.
Parameter Selection
As visible in Figure 2, both fluorescent parameters and image derived parameters can be used to identify nearest neighbors. Keep in mind that this tool will only used the numeric value of each of the image derived parameters in doing this calculation, so a limitation of this tool is that it will not use specific spatial information in determining similarity. One big long cell will have a very similar eccentricity measure compared to two smaller cells abutting. Thus, providing the algorithm more parameters to work with improves its ability to identify similarity.
The algorithm attempts to select all of the fluorescent parameters by default. This will likely include the raw image channels, ImgB1 – ImgB3, as well as the second set of unmixed parameters that include the SW-unmix suffix. It is almost always worth deselecting these.
Output
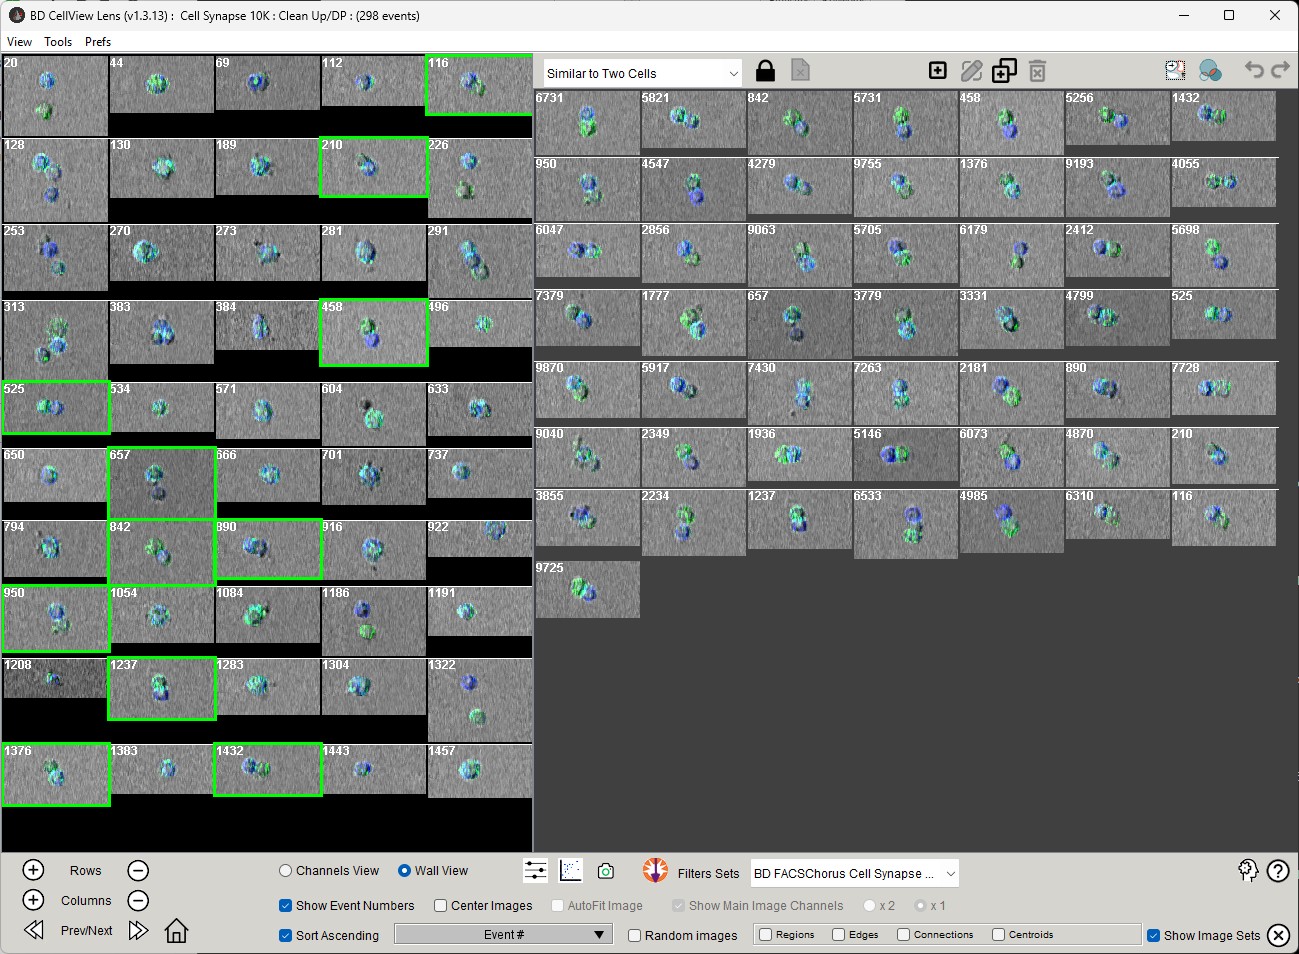
The algorithm will work quickly if all of the images are already on your local computer. A larger number of requested similar images will take more time. Once it completes you will see your image set update with the number of request images, and a new image set appear called ‘Similar to…’ whatever your original set was.

Figure 3: Output of the KNN search
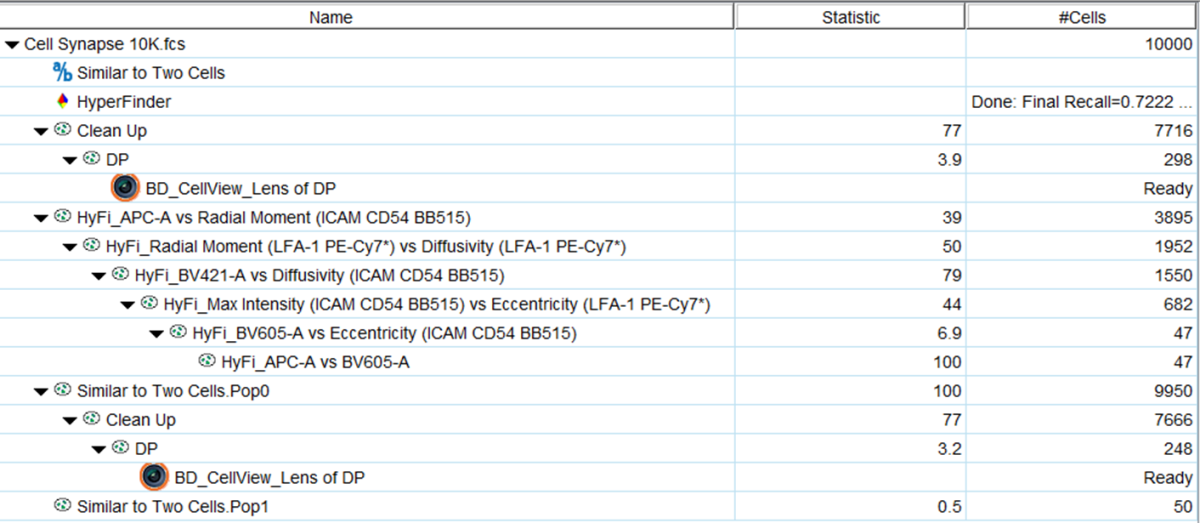
If you click the Create population button next to the KNN button, FlowJo will create two populations in your hierarchy, the similar images and the NOT of that population.

Figure 4: Output populations in the FlowJo workspace
These populations can be plotted, gated on, clustered, or refined in any way that any population in FlowJo can be interrogated. The not of the population is created so that one by use it as the counter example for training a classifier to distinguish between the two and identify the cells of interest. Because the NOT population is always created from the root population, it will tend to be overly general. You may want to apply any clean up gating you performed to the NOT population if you plan to use it further.
In Figure 5, some options for further analysis are shown. Observe that if the clean up and double positive gates (DP) are dragged from the root level to the NOT gate, the 248 cells that were not among the 50 nearest neighbors are returned, giving you a refined set to train against if you prefer. Also, Hyperfinder was run on the Similar population. Observe that a series of 6 polygon gates with the prefix HyFi recovered 47 of the 50 ‘similar’ cells, using the parameters noted in each gate name. You can see that a mixture of fluorescent and image derived parameters were used to achieve this. These gates could be used to find more of the same type of cell on another file in this experiment, or opened on the BD FACSChorusTM Software and used to sort the identified cell type. Last, a CellView Lens node was dropped on the gated NOT population, indicating that you can look at images of these specific cells as well.

Figure 5: Further analysis
